Sleep Stage Analysis using EEG Data
This project analyzes EEG data from 10 subjects (5 normal, 3
insomniacs, 2 narcoleptic) for the purpose of visualizing and
comparing sleep stage patterns. Data includes .edf EEG files, .txt
annotations, and .edf.st annotations, all sourced from the CAP
Sleep Database.
The final goal is to visualize sleep patterns across different
conditions and stages i.e. Wakeful (w), s1, s2, s3, Rapid Eye
Movement (REM)
Preprocessing & Annotation Extraction
The .txt files have header lines that have to be parsed out and annotations for sleep stages are to be extracted. Extracting the annotations from .txt files and converting them into a dataframe.
Hypnograms
Hypnograms are graphical representations of sleep stages over time. They provide a visual summary of the sleep architecture, showing the transitions between different sleep stages.
Normal Subject Hypnogram
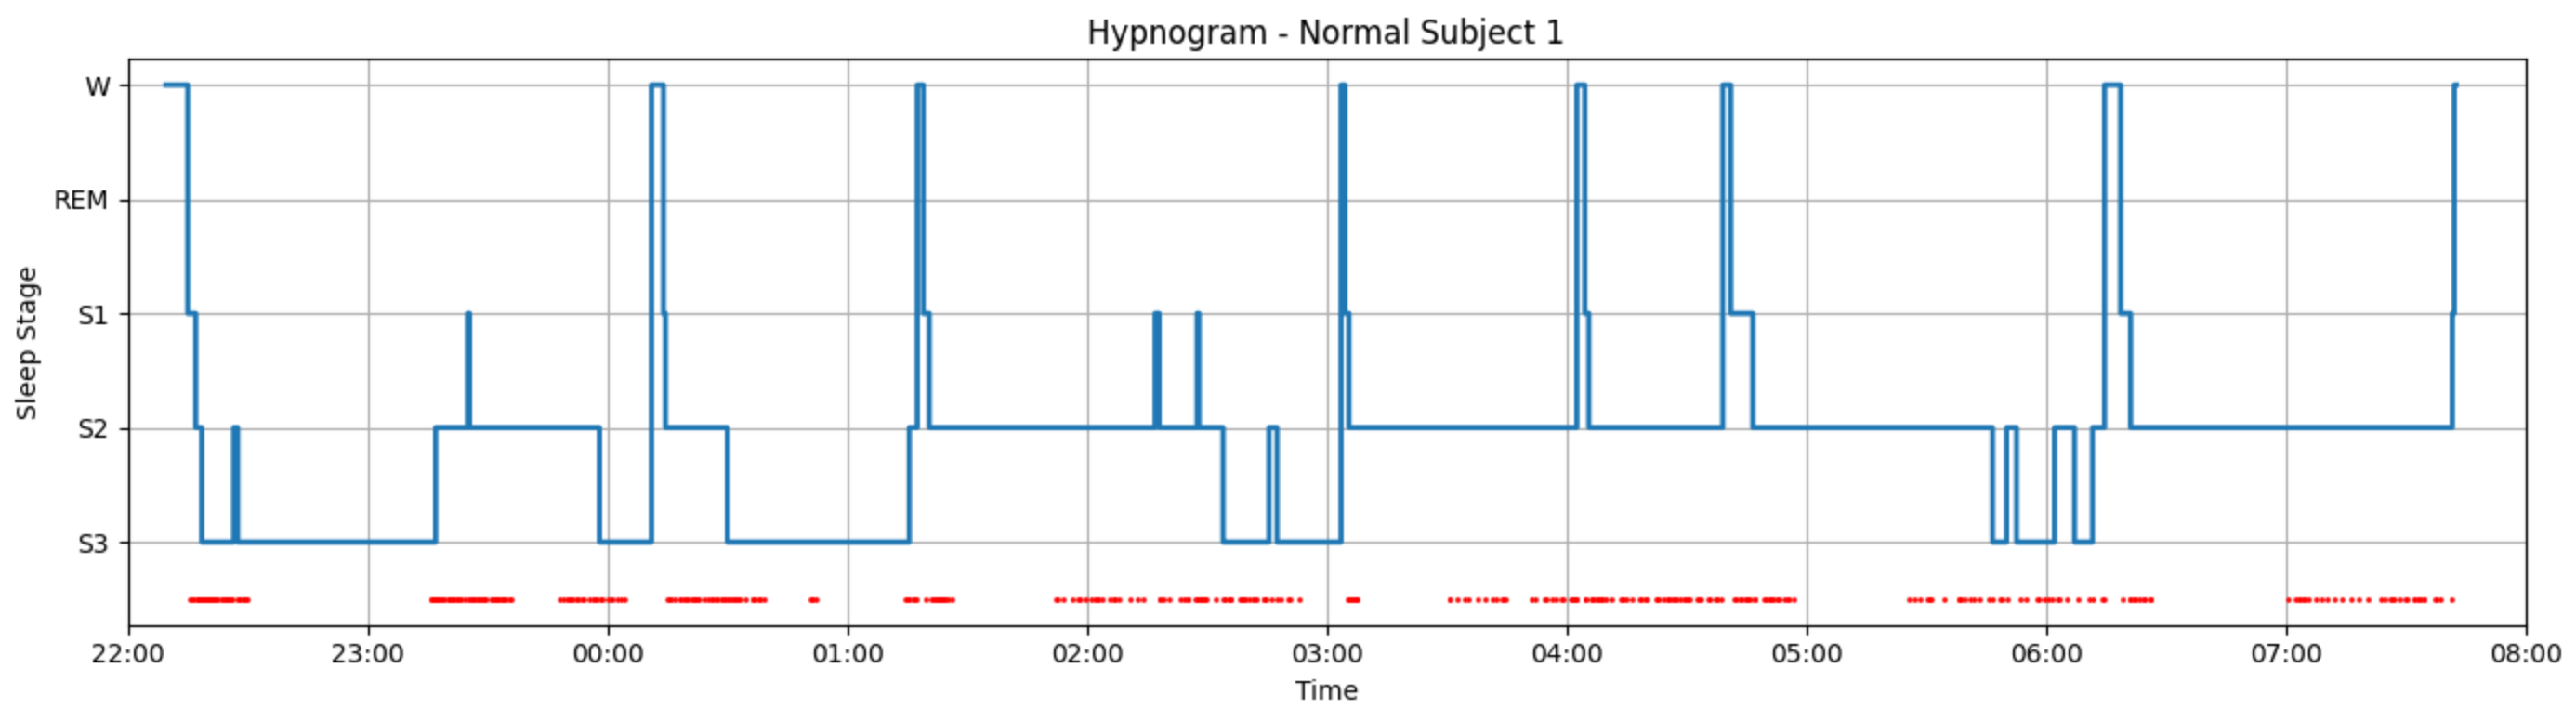
This hypnogram displays a typical, healthy sleep cycle. The subject progresses through sleep stages in regular cycles, with deep sleep (S3) appearing prominently in the early part of the night and REM sleep becoming more frequent in the later hours. Brief awakenings are normal and limited. MCAP events (in red) are evenly distributed and sparse, suggesting stable and undisturbed sleep architecture.
Insomniac Subject Hypnogram
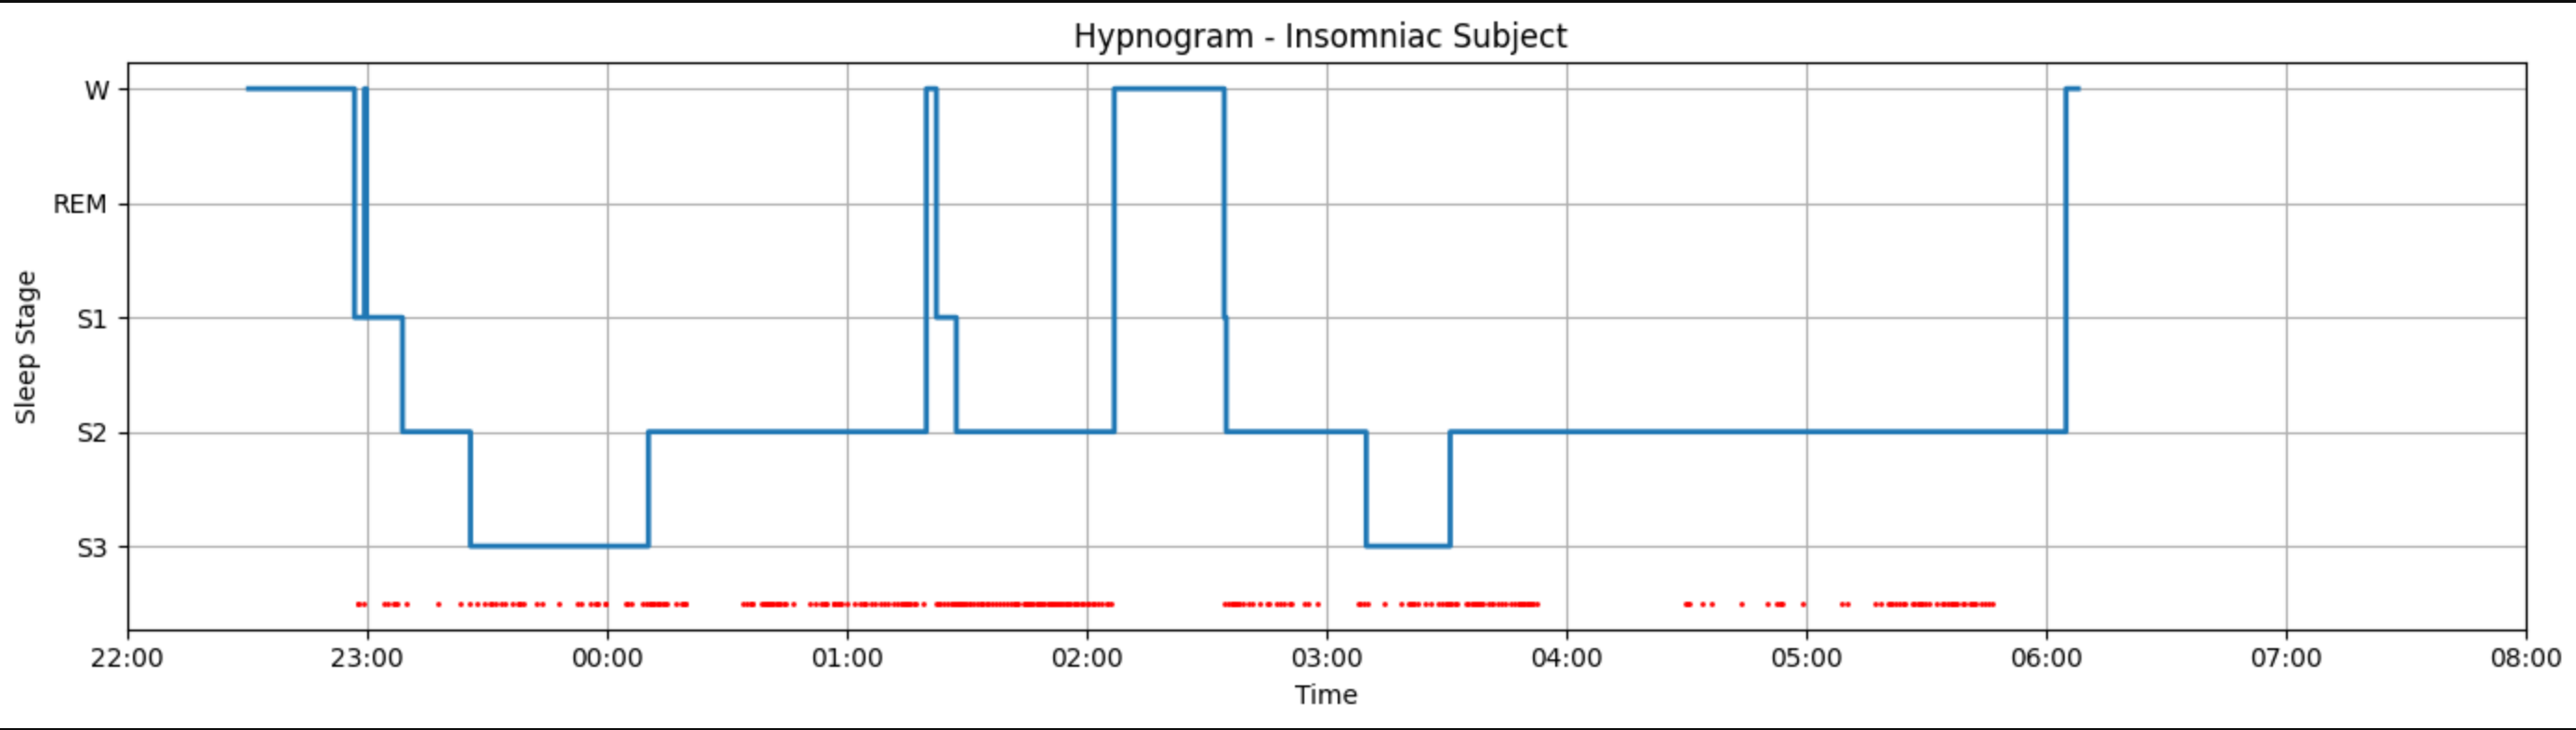
This subject shows clear signs of disrupted sleep. Long periods of wakefulness are seen, especially at the beginning and middle of the night. Transitions between stages are less frequent, and REM sleep is notably absent or very limited. MCAP events are more clustered, hinting at micro-arousals or instability in sleep continuity—hallmarks of insomnia.
Narcoleptic Subject Hypnogram
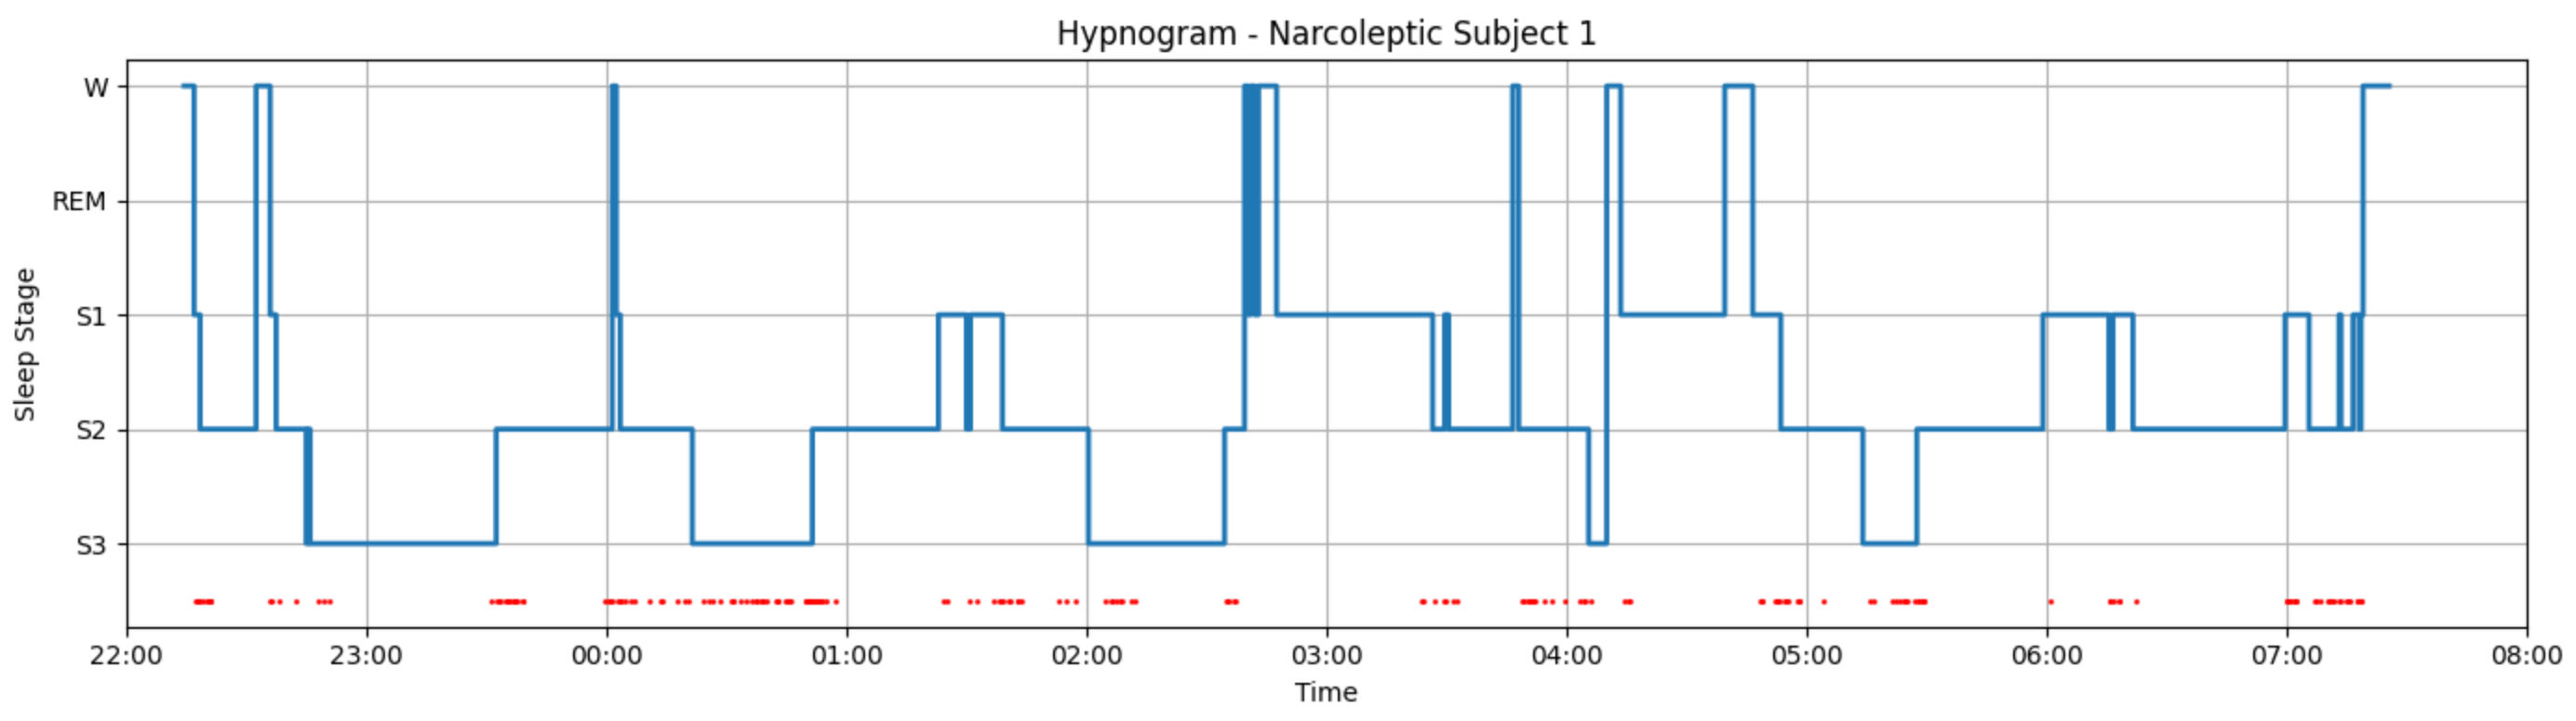
The hypnogram indicates frequent and abrupt transitions between wake, REM, and light sleep stages. REM sleep appears unusually early and recurs throughout the night, which is a classic marker of narcolepsy. Sleep cycles are fragmented, with reduced time spent in deep sleep (S3). High MCAP density aligns with disturbed and unstable sleep.
Band Power Analysis
Band power analysis measures the strength of brainwave activity in specific frequency ranges Delta (0.5–4 Hz) for deep sleep, Theta (4–8 Hz) for light sleep, Alpha (8–13 Hz) for relaxed wakefulness, and Beta (13–30 Hz) for alertness. It reveals how brain activity varies across sleep stages.
Normal Subject
Normal Individual: Expect higher Delta and Theta power during wakefulness and deep sleep (S3, S4), with minimal Alpha and Beta activity, reflecting typical brain activity patterns consistent with healthy sleep cycles.
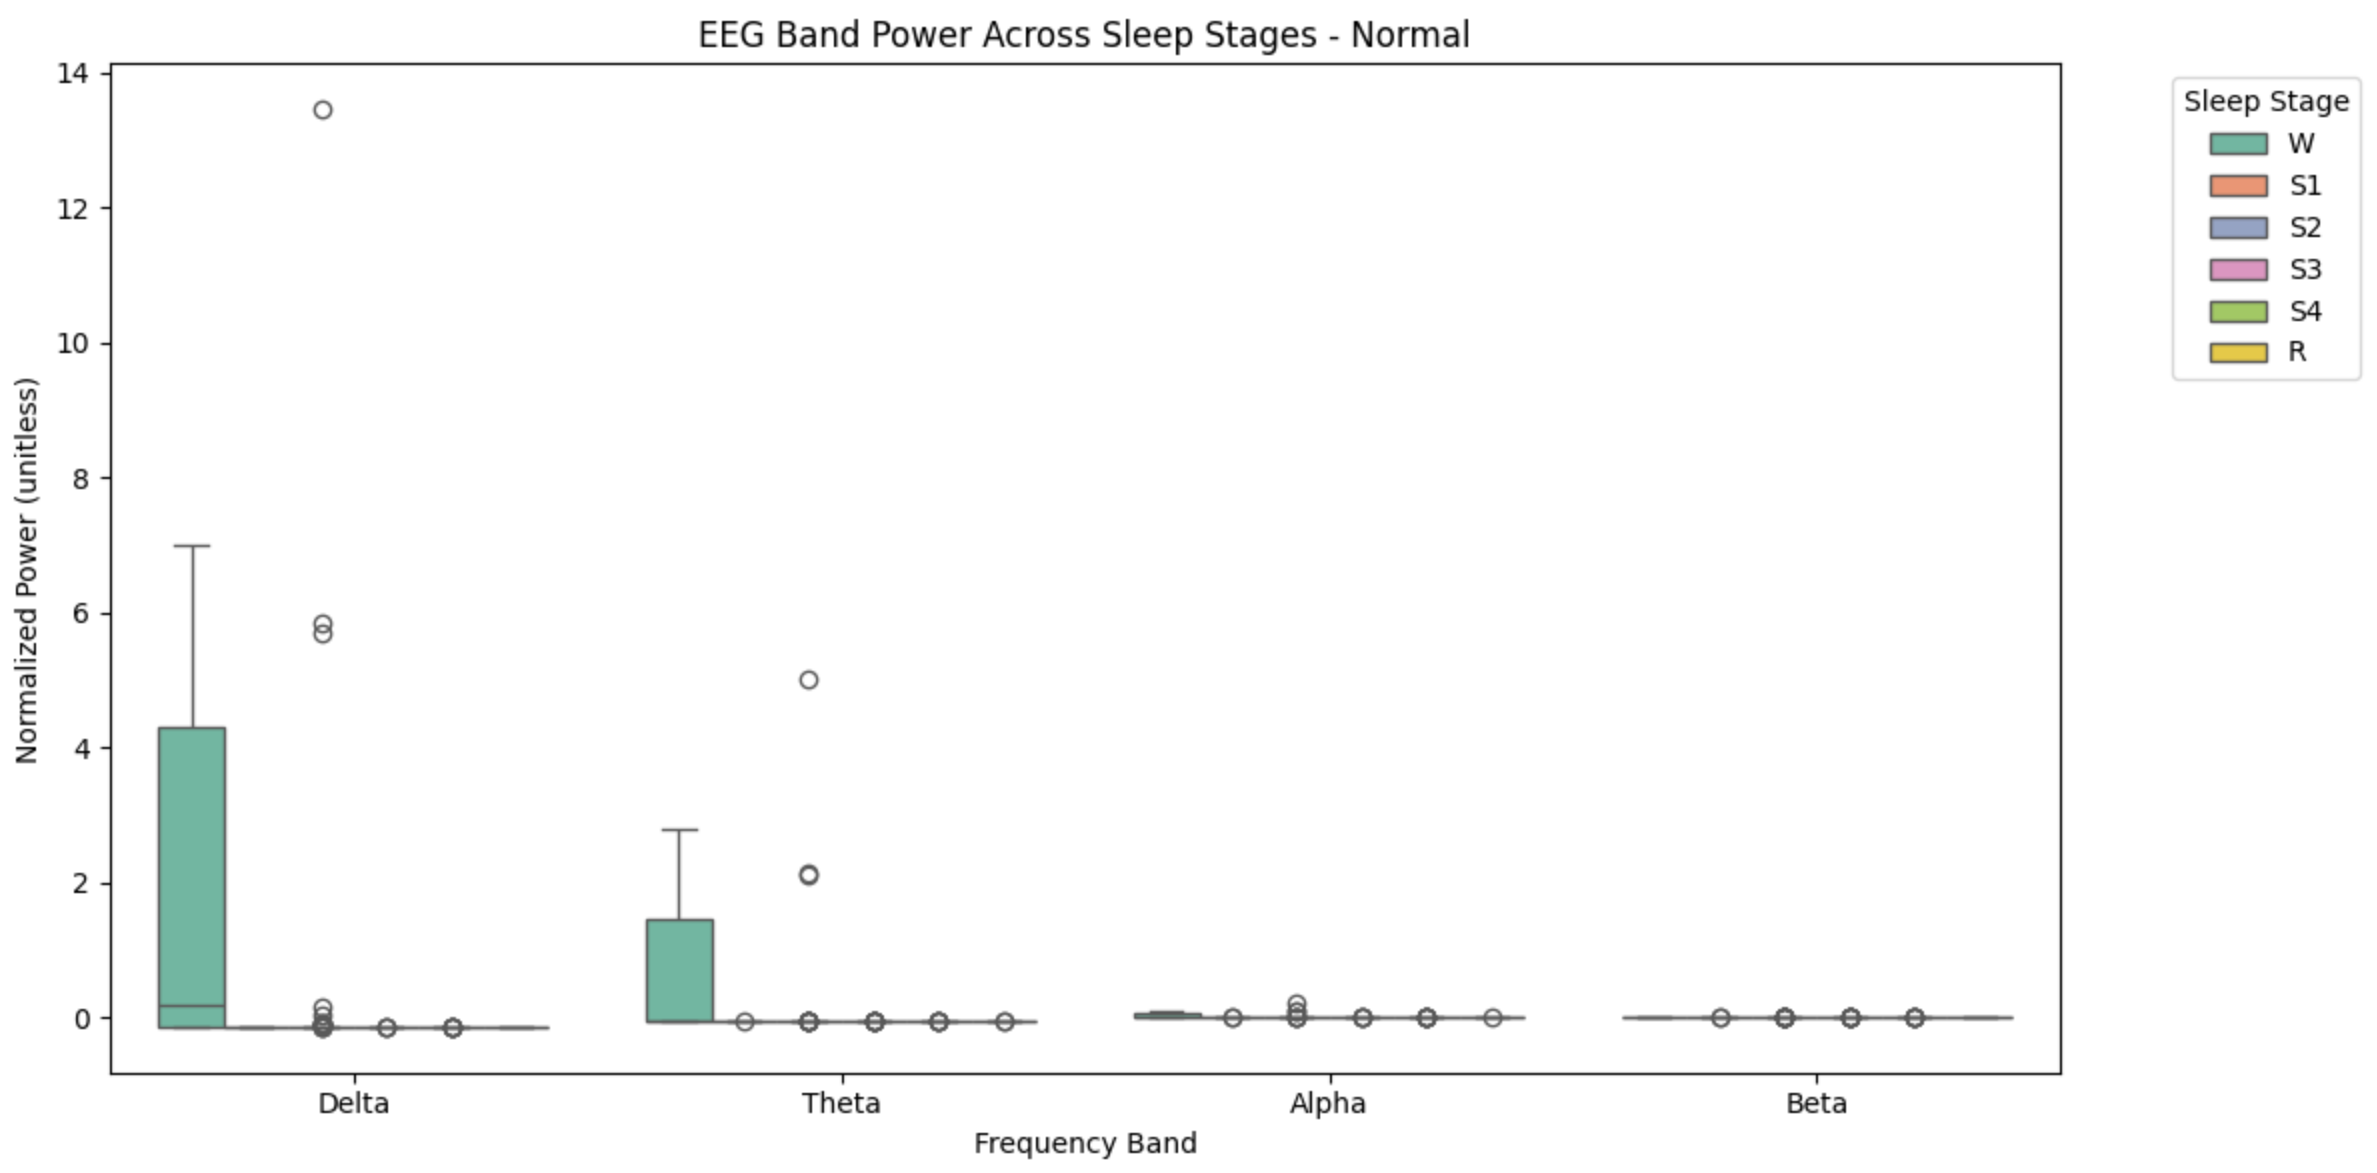
This shows that a normal individual exhibits the highest normalized Delta power (around 4-5 units) during wakefulness (W), with moderate Theta power (around 2 units) across various stages, and negligible Alpha and Beta activity. This pattern reflects typical brain activity, with dominant Delta waves during wakefulness and a smooth transition to lighter sleep stages, consistent with healthy sleep architecture.
Insomniac Subject
Insomnia: Anticipate reduced Delta power and increased Alpha or Beta activity during intended sleep stages, indicating difficulty transitioning to and maintaining deep sleep, a common feature of insomnia.

This shows that individuals with insomnia exhibit elevated Theta power during the S1 sleep stage (around 3-4 units), with noticeable Delta and Alpha activity during wakefulness (W) and lighter sleep stages (S2, S3). Beta power remains low across all stages. This suggests difficulty transitioning to deeper sleep, with persistent wake-like brain activity (higher Alpha and Theta) during intended sleep periods, consistent with insomnia patterns where deep sleep (Delta dominance) is reduced.
Narcoleptic Subject
Narcolepsy: Look for irregular transitions with elevated Delta and Theta power during wakefulness or rapid eye movement (R) intrusions, reflecting disrupted sleep-wake cycles characteristic of narcolepsy.

This shows that individuals with narcolepsy exhibit a notable Delta power peak (around 4 units) during wakefulness (W), with minimal activity in other bands. Theta and Alpha bands show moderate power during S2 and R stages, while Beta power remains negligible across all stages. This pattern suggests abnormal Delta wave presence during wakefulness, a hallmark of narcolepsy, reflecting disrupted sleep-wake transitions and potential rapid entry into sleep or REM-like states.
Sleep Stage Distribution
Normal Subject: The pie chart for a normal subject typically shows
a balanced sleep structure. The majority of sleep is spent in
Stage 2 and REM, with a healthy amount of deep sleep (S3) and a
smaller portion in light sleep (S1) and Wake (W). This reflects
stable and restorative sleep architecture.
Insomniac Subject: In insomniac subjects, the chart reveals a
disproportionate amount of time in the Wake stage. Deep sleep (S3)
and REM are often significantly reduced, while light stages like
S1 may be scattered. This suggests fragmented, poor-quality sleep
with difficulty maintaining deeper stages.
Narcoleptic Subject: Narcoleptic sleep patterns are marked by
abnormal REM distribution, often with REM taking up a
larger-than-usual portion. Deep sleep (S3) might be limited, and
stage transitions are irregular. The chart may reflect direct
transitions from Wake to REM or inconsistent cycling.

Normal sleepers show a well-balanced distribution across all
stages. The majority of their sleep is spent in Stage 2 (S2) at
~43%, which is typical. Deep sleep (S3) is also well-represented
at ~29%, indicating healthy restorative sleep. REM accounts for
~14%, supporting cognitive processing and dreaming, while
wakefulness (W) is minimal at ~7.7%, reflecting efficient sleep
cycles.
Insomniacs exhibit disrupted sleep patterns with a 27.5% spent
awake (W), nearly four times higher than normals. Deep sleep
(S3) is severely reduced to 15.3%, and REM also drops to 11.6%,
both signs of poor sleep quality. Although S2 still dominates
(~39.7%), the loss in restorative and REM stages highlights the
impact of insomnia on sleep architecture.
Narcoleptic subjects spend a significant amount of time in REM
sleep (17.4%), higher than both normals and insomniacs,
consistent with rapid REM onset often seen in narcolepsy. They
maintain decent S3 (23%) and high S2 (47%) proportions,
suggesting relatively preserved non-REM structure. Wake time is
low (~7.5%), but the altered REM balance points to their unique
sleep profile.
Power Spectral Density
Power Spectral Density (PSD) plots show the distribution of power across different frequency bands. They help visualize how brain activity varies with sleep stages.
It is a measure used to analyze the strength of various frequency components in a signal, such as brain waves in an EEG. It shows how the power (or energy) of the signal is distributed across different frequencies, in units like dB/µV²/Hz. In EEG, PSD helps identify dominant brain wave patterns (e.g., Delta, Theta, Alpha, Beta) and their intensity, providing insights into sleep stages, neurological conditions, or brain activity states.
Normal Subject PSD
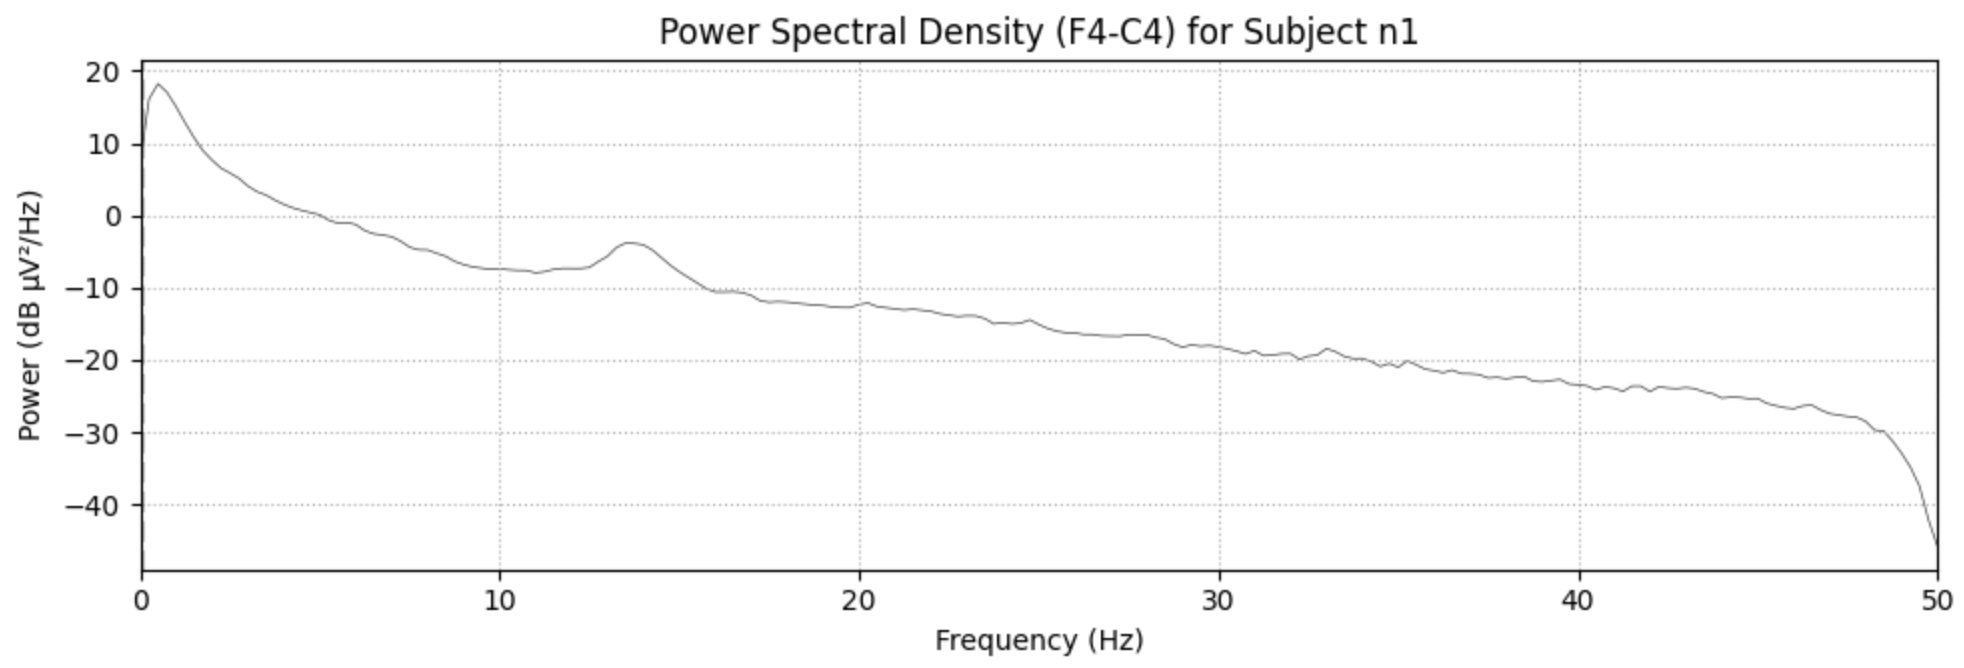
The power spectral density (F4-C4) plot for Subject n1, a normal person, shows the strongest brain activity (around 0 dB/µV²/Hz) at low frequencies below 5 Hz, which is the Delta range. This gradually drops to about -30 dB/µV²/Hz by 50 Hz as it moves through Theta, Alpha, and Beta bands. This pattern reflects typical brain waves, with the most activity at lower frequencies during a restful state, matching a healthy EEG.
Insomniac Subject PSD
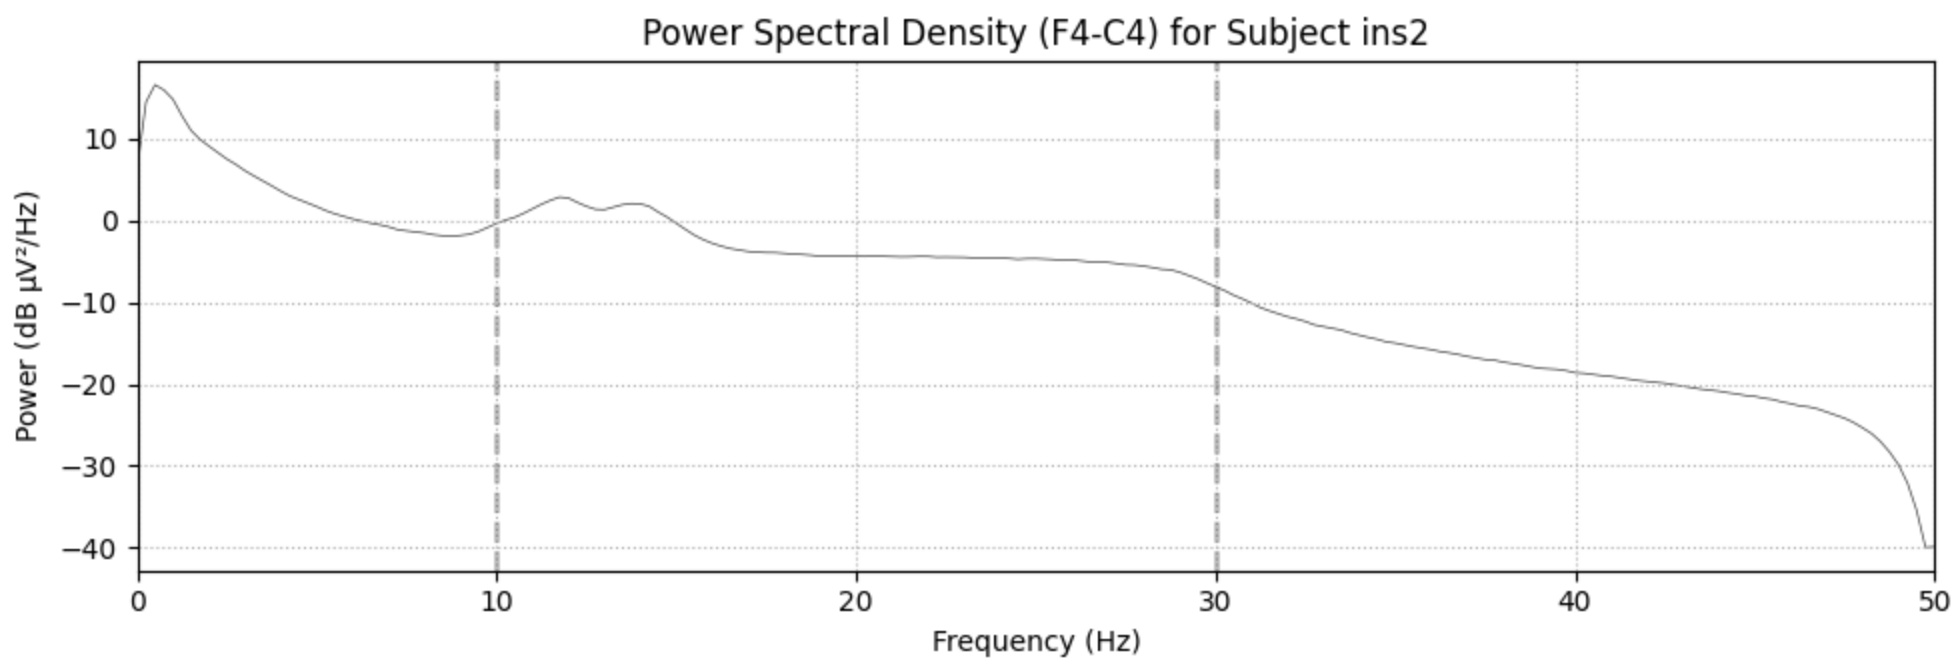
The power spectral density (F4-C4) plot for Subject ins2, an insomniac shows a peak power around 0 dB/µV²/Hz at low frequencies below 5 Hz, likely in the Delta range, followed by a decline to about -30 dB/µV²/Hz by 50 Hz. A noticeable rise in power around 10-15 Hz (Alpha range) suggests increased activity, which, combined with the "ins2" label, may indicate insomnia-like patterns where wakeful brain activity persists. This pattern is atypical for a restful state, as it shows more activity in the Alpha range than expected during sleep, indicating disrupted sleep architecture.
Narcoleptic Subject PSD

The power spectral density (F4-C4) plot for Subject narco1, a narcoleptic, shows a peak power around 0 dB/µV²/Hz at low frequencies below 5 Hz (Delta range), with sustained activity into higher frequencies, declining to -30 dB/µV²/Hz by 50 Hz. The persistent low-frequency power during wakefulness suggests abnormal Delta wave intrusion, a key indicator of narcolepsy, where sleep-like brain patterns disrupt normal wakeful states
Frequency Bands & EEG Heatmaps
Normal Subjects' EEG Analysis

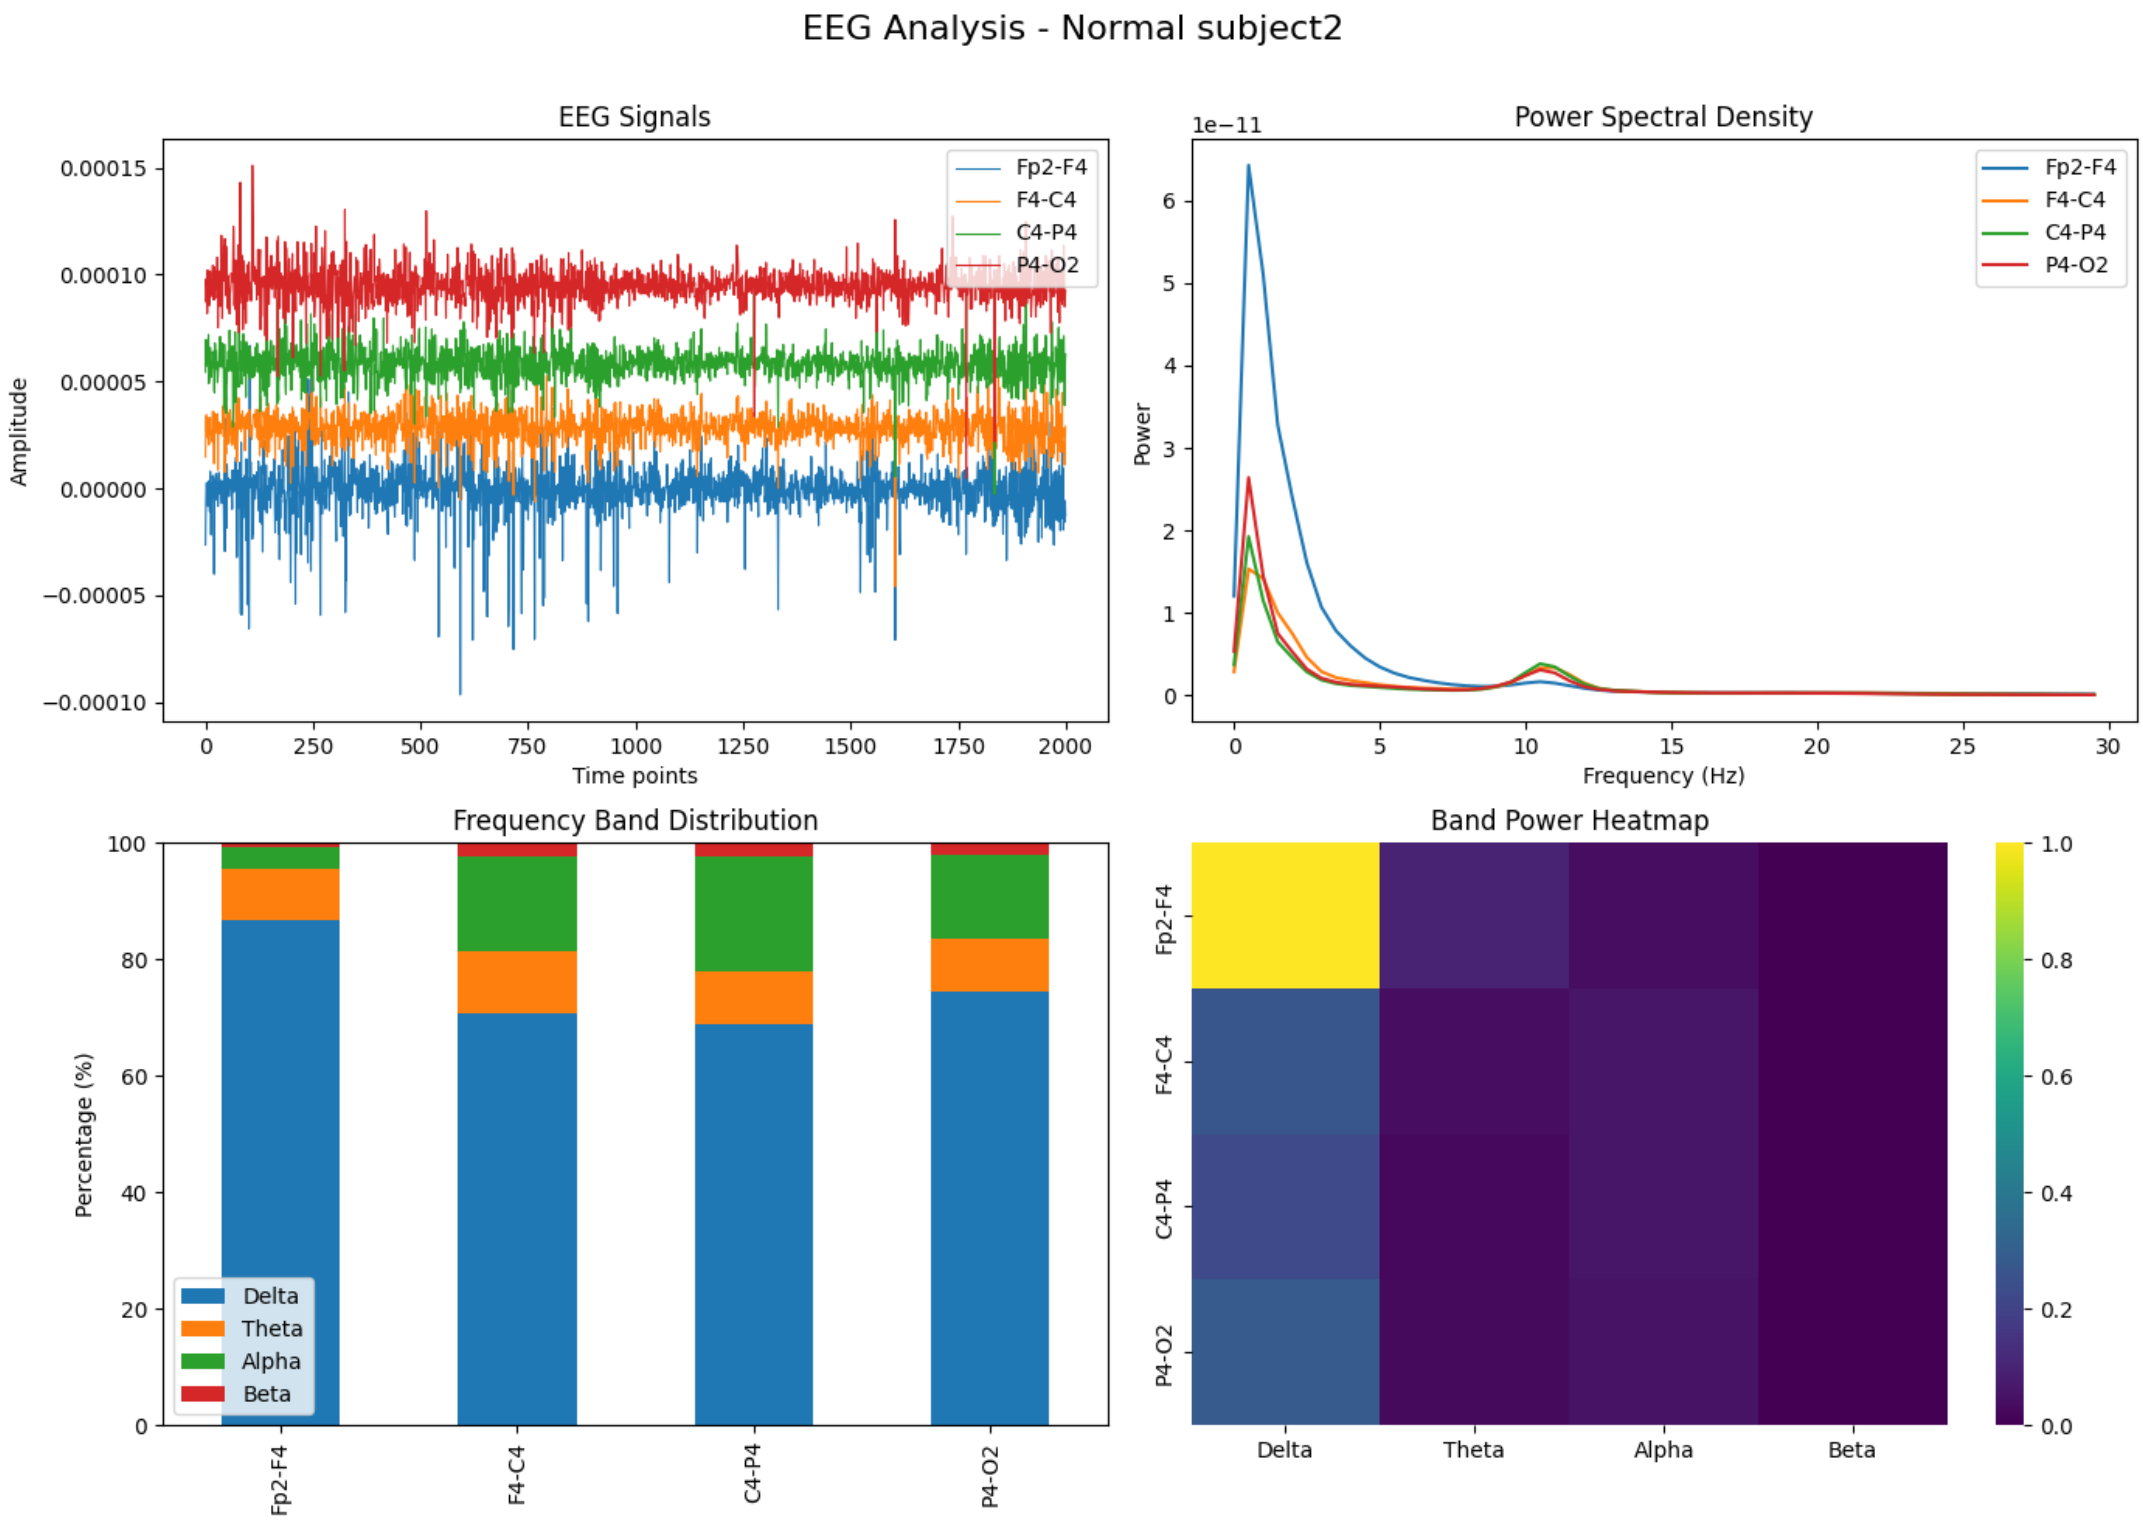
The EEG analyses of Normal subject1 and subject2 show strong indicators of healthy brain activity during sleep. Both subjects exhibit a high dominance of Delta waves across all channels, suggesting deep, restorative non-REM sleep. This is typical of normal sleep architecture.
The Beta band activity is minimal, which aligns with relaxed or sleep states and rules out abnormal wakefulness or stress.
The Power Spectral Density plots further confirm strong power in low-frequency bands (Delta and Theta), with no abnormal high-frequency spikes. EEG waveforms appear smooth and consistent, free from artifacts or irregularities.
The band power heatmaps show balanced distribution across channels, reflecting symmetrical brain activity.
Insomniac Subjects' EEG Analysis
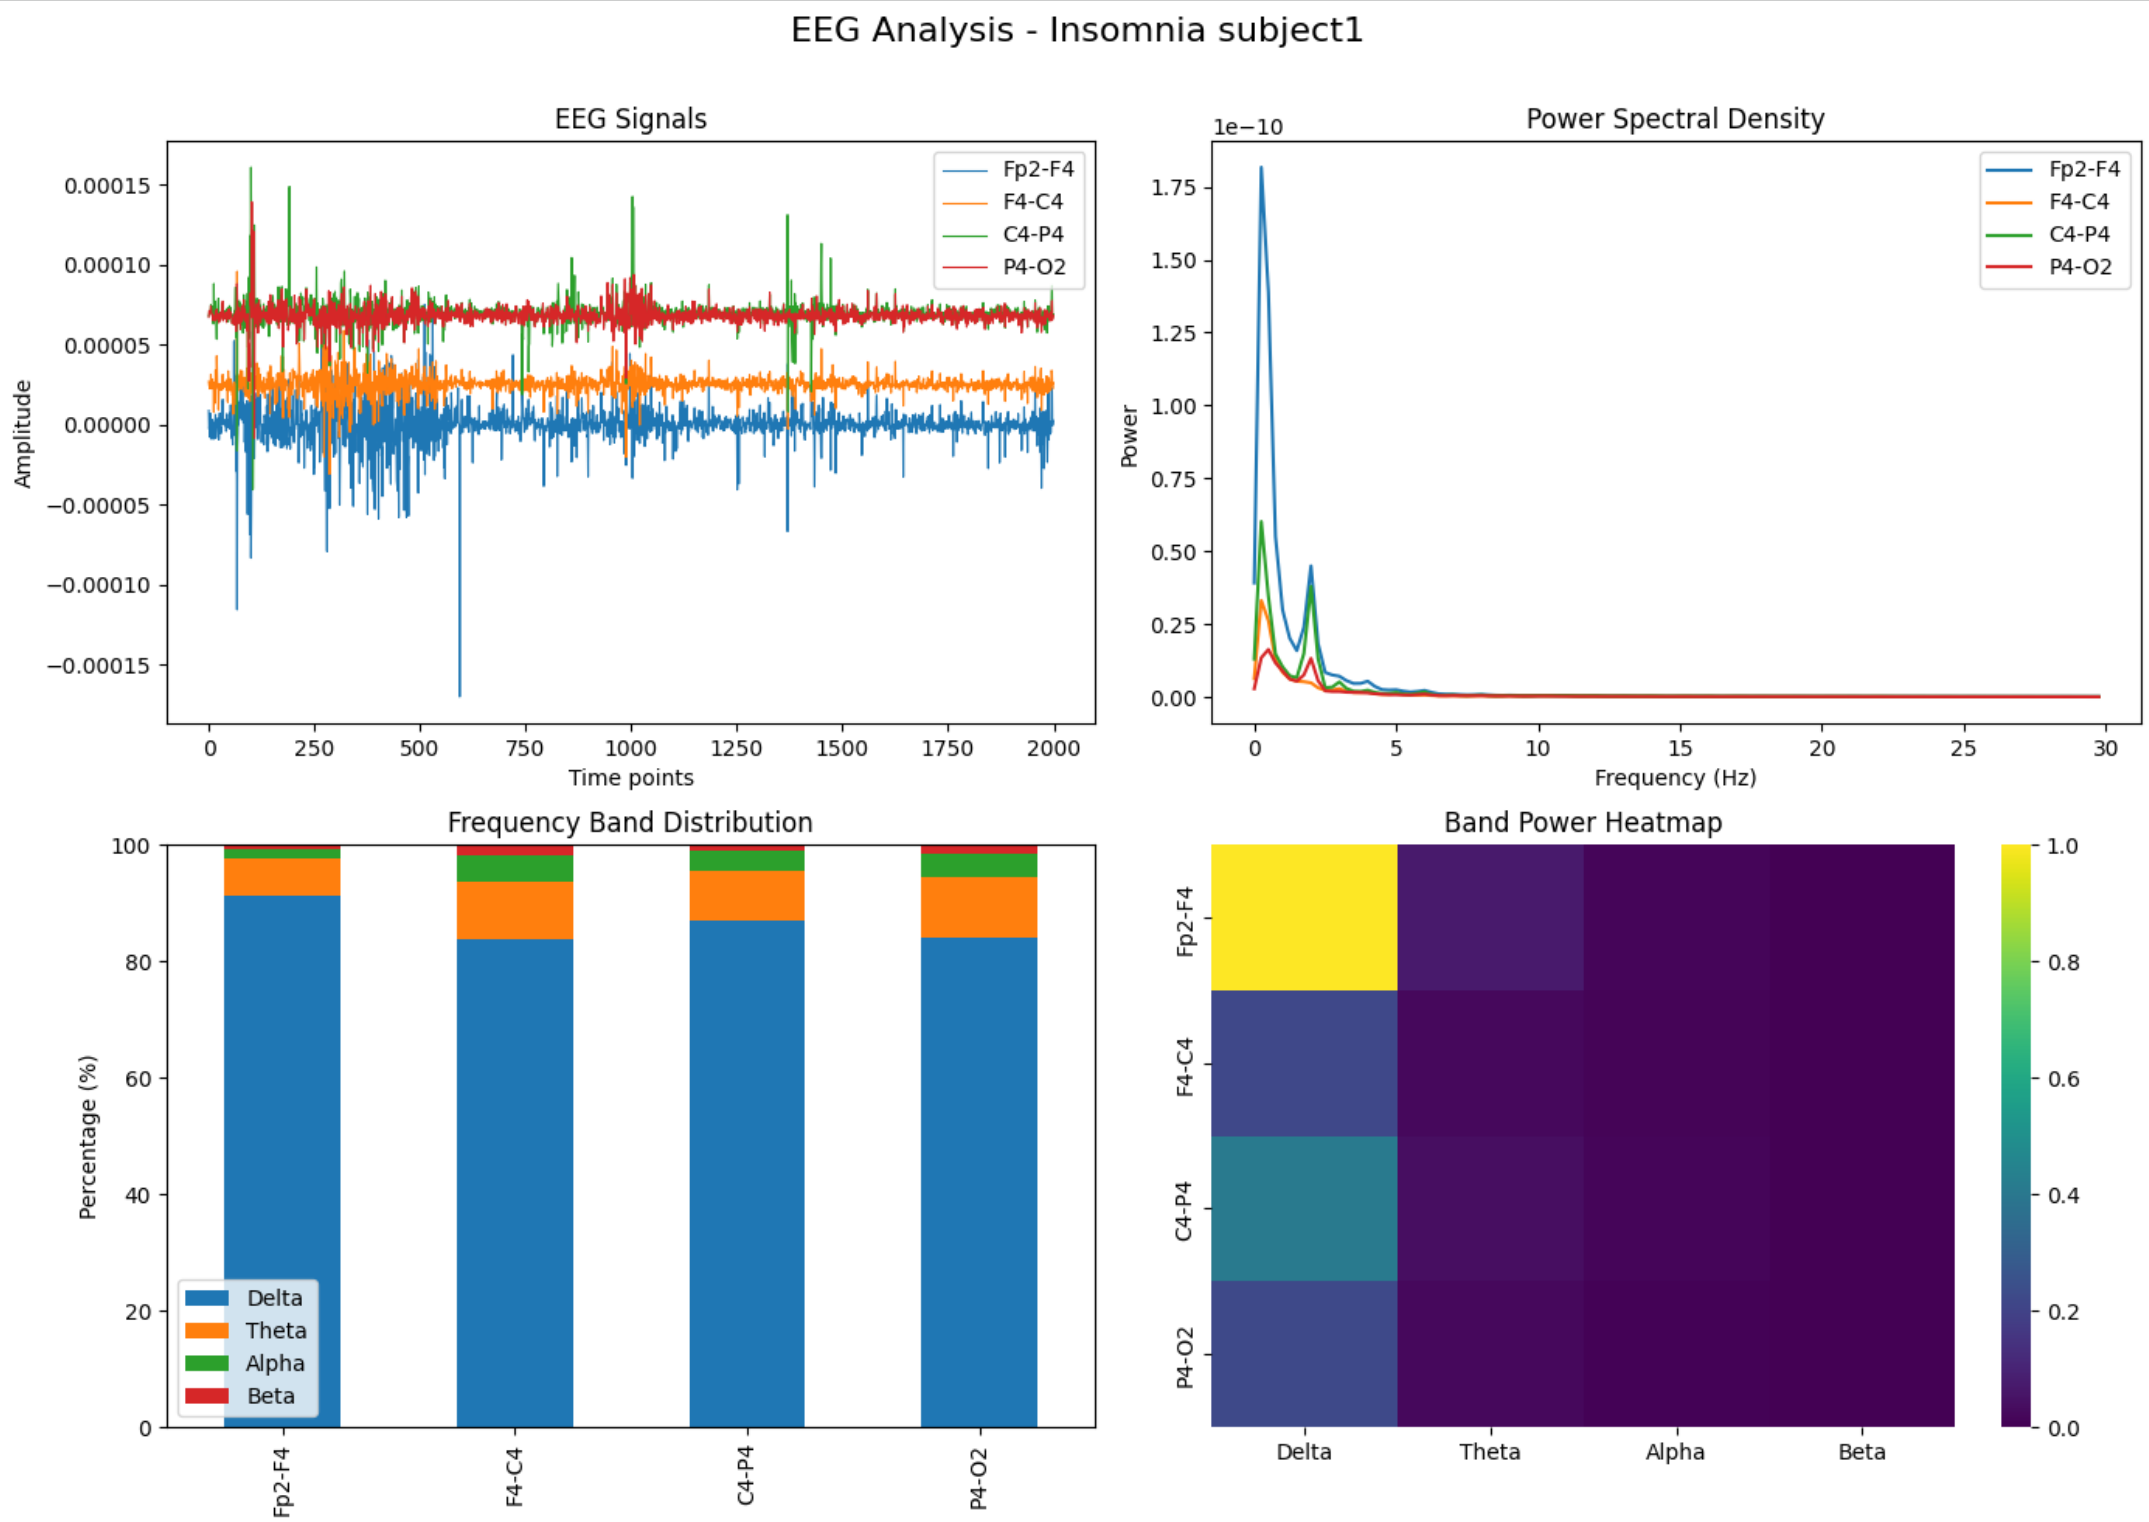
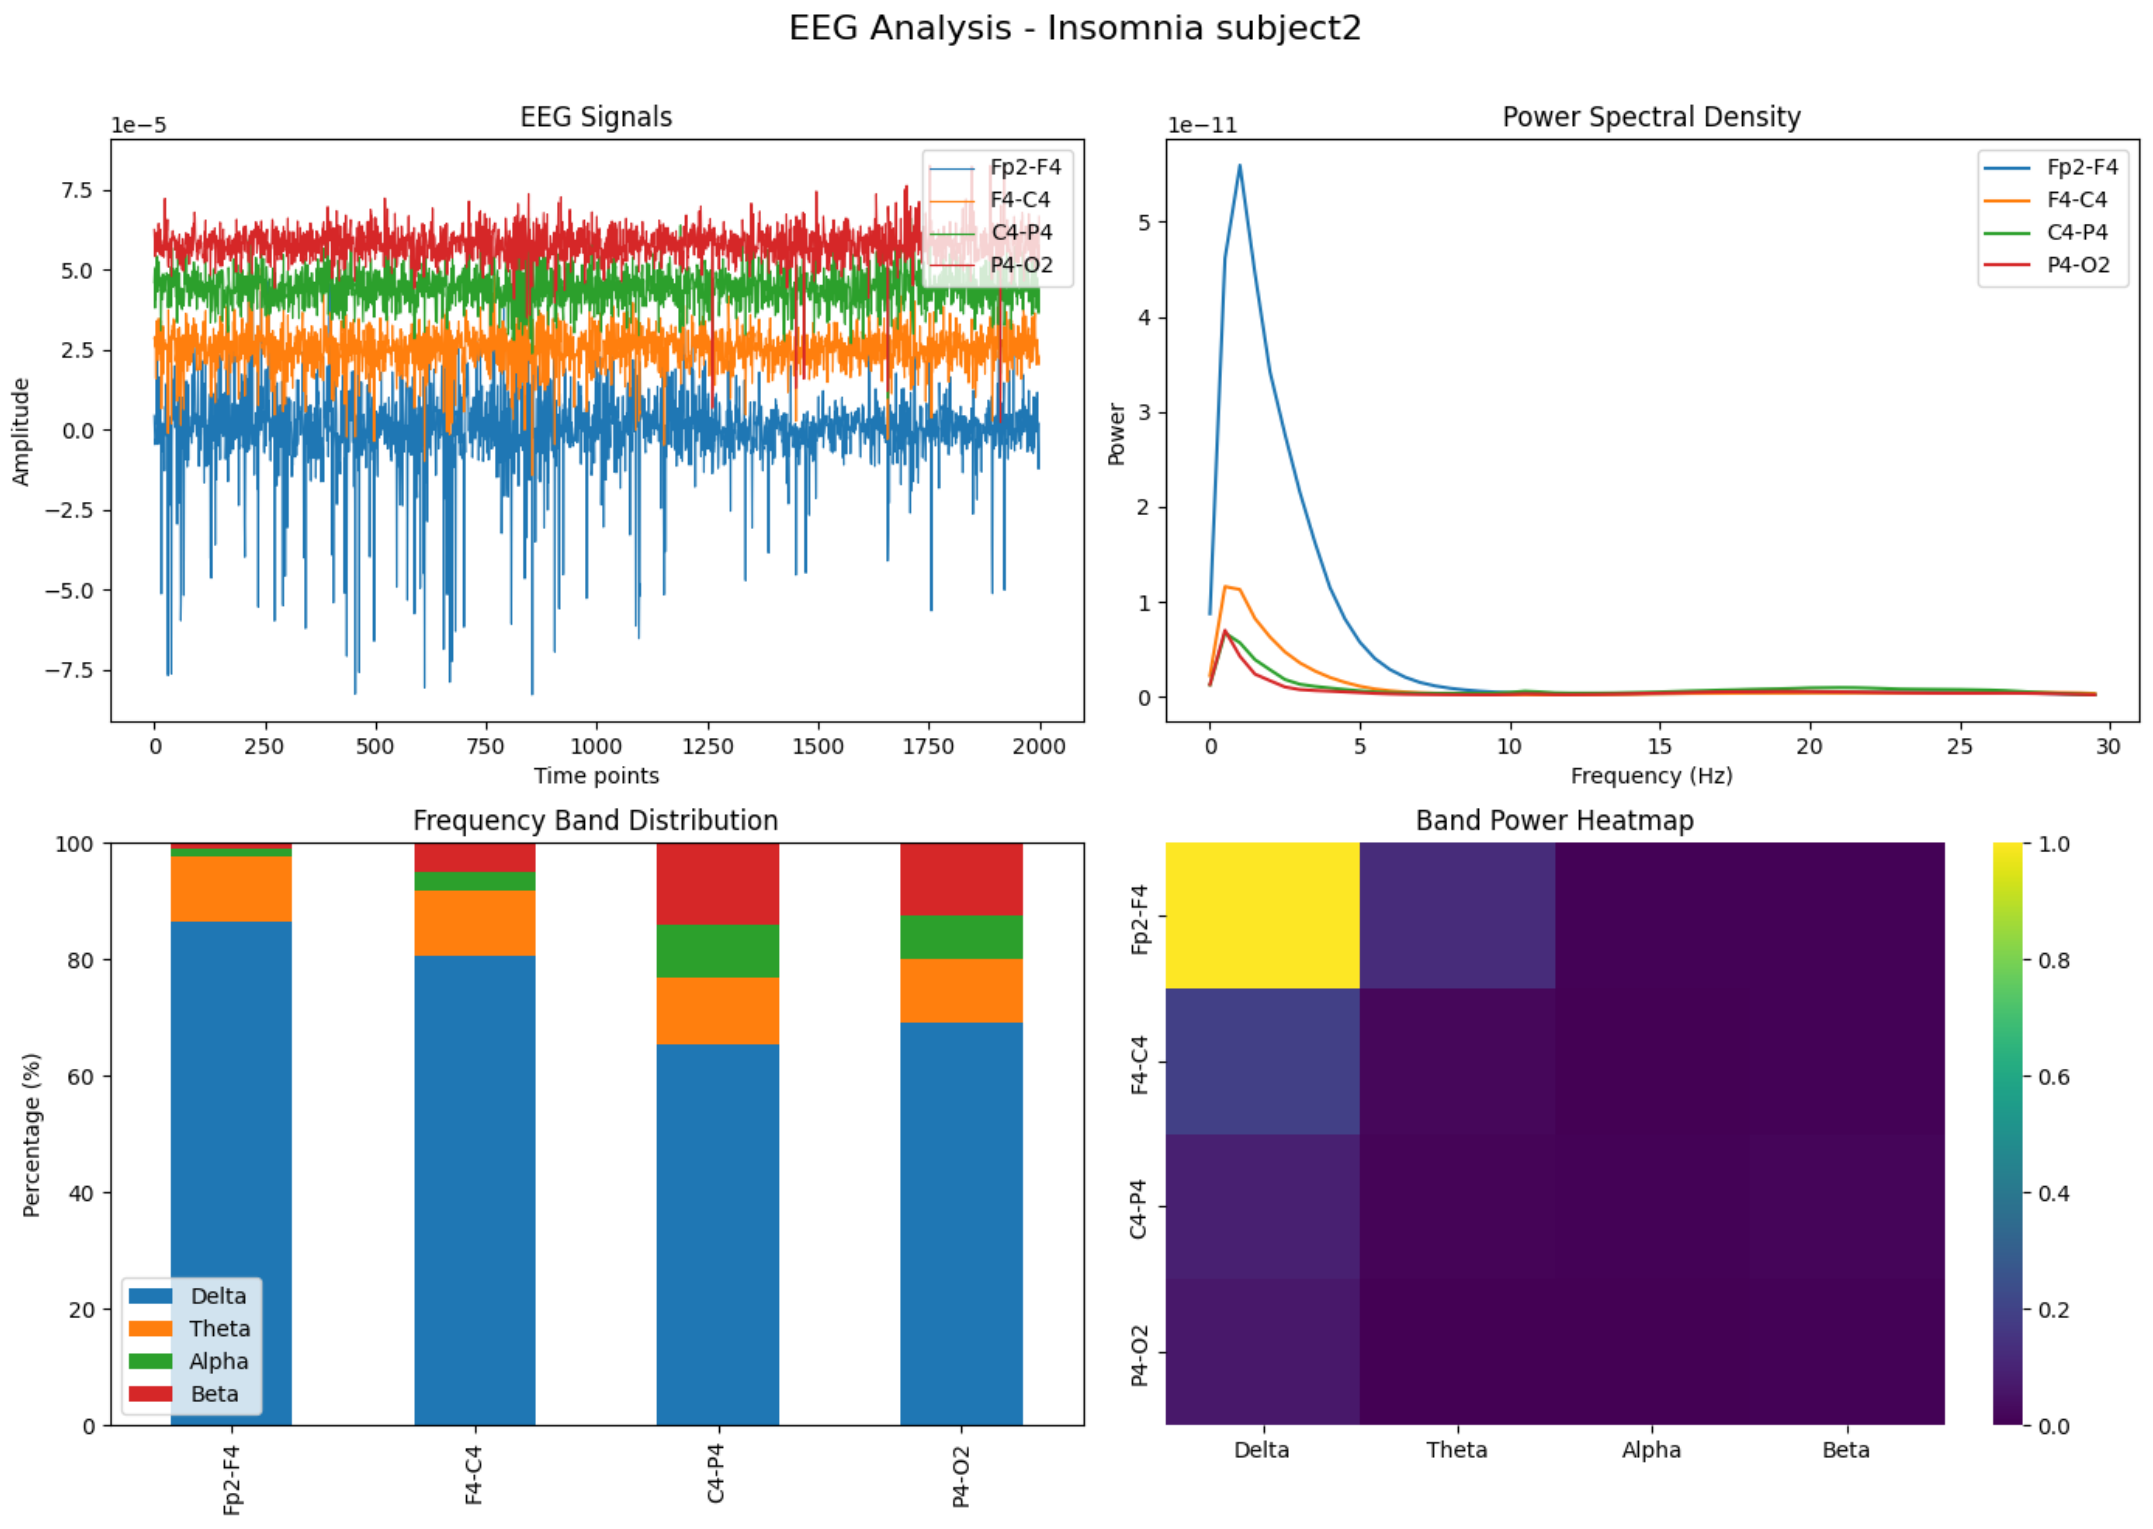
Insomnia Subject 1: Delta waves dominate in all regions, especially frontal (Fp2-F4), with very low Alpha and Beta activity. PSD shows a sharp peak at low frequency, and C4-P4 stands out with slightly higher Delta power. Overall, there's reduced variation across frequencies, indicating shallow, fragmented sleep.
Insomnia Subject 2: Fp2-F4 again shows high Delta power, but all other regions are relatively flat across bands. PSD drops steeply after Delta. Heatmap shows almost no presence of higher bands (Alpha, Beta), pointing to a lack of normal sleep depth progression. This suggests a consistent pattern of shallow sleep with minimal transitions to deeper stages.
Narcoleptic Subjects' EEG Analysis
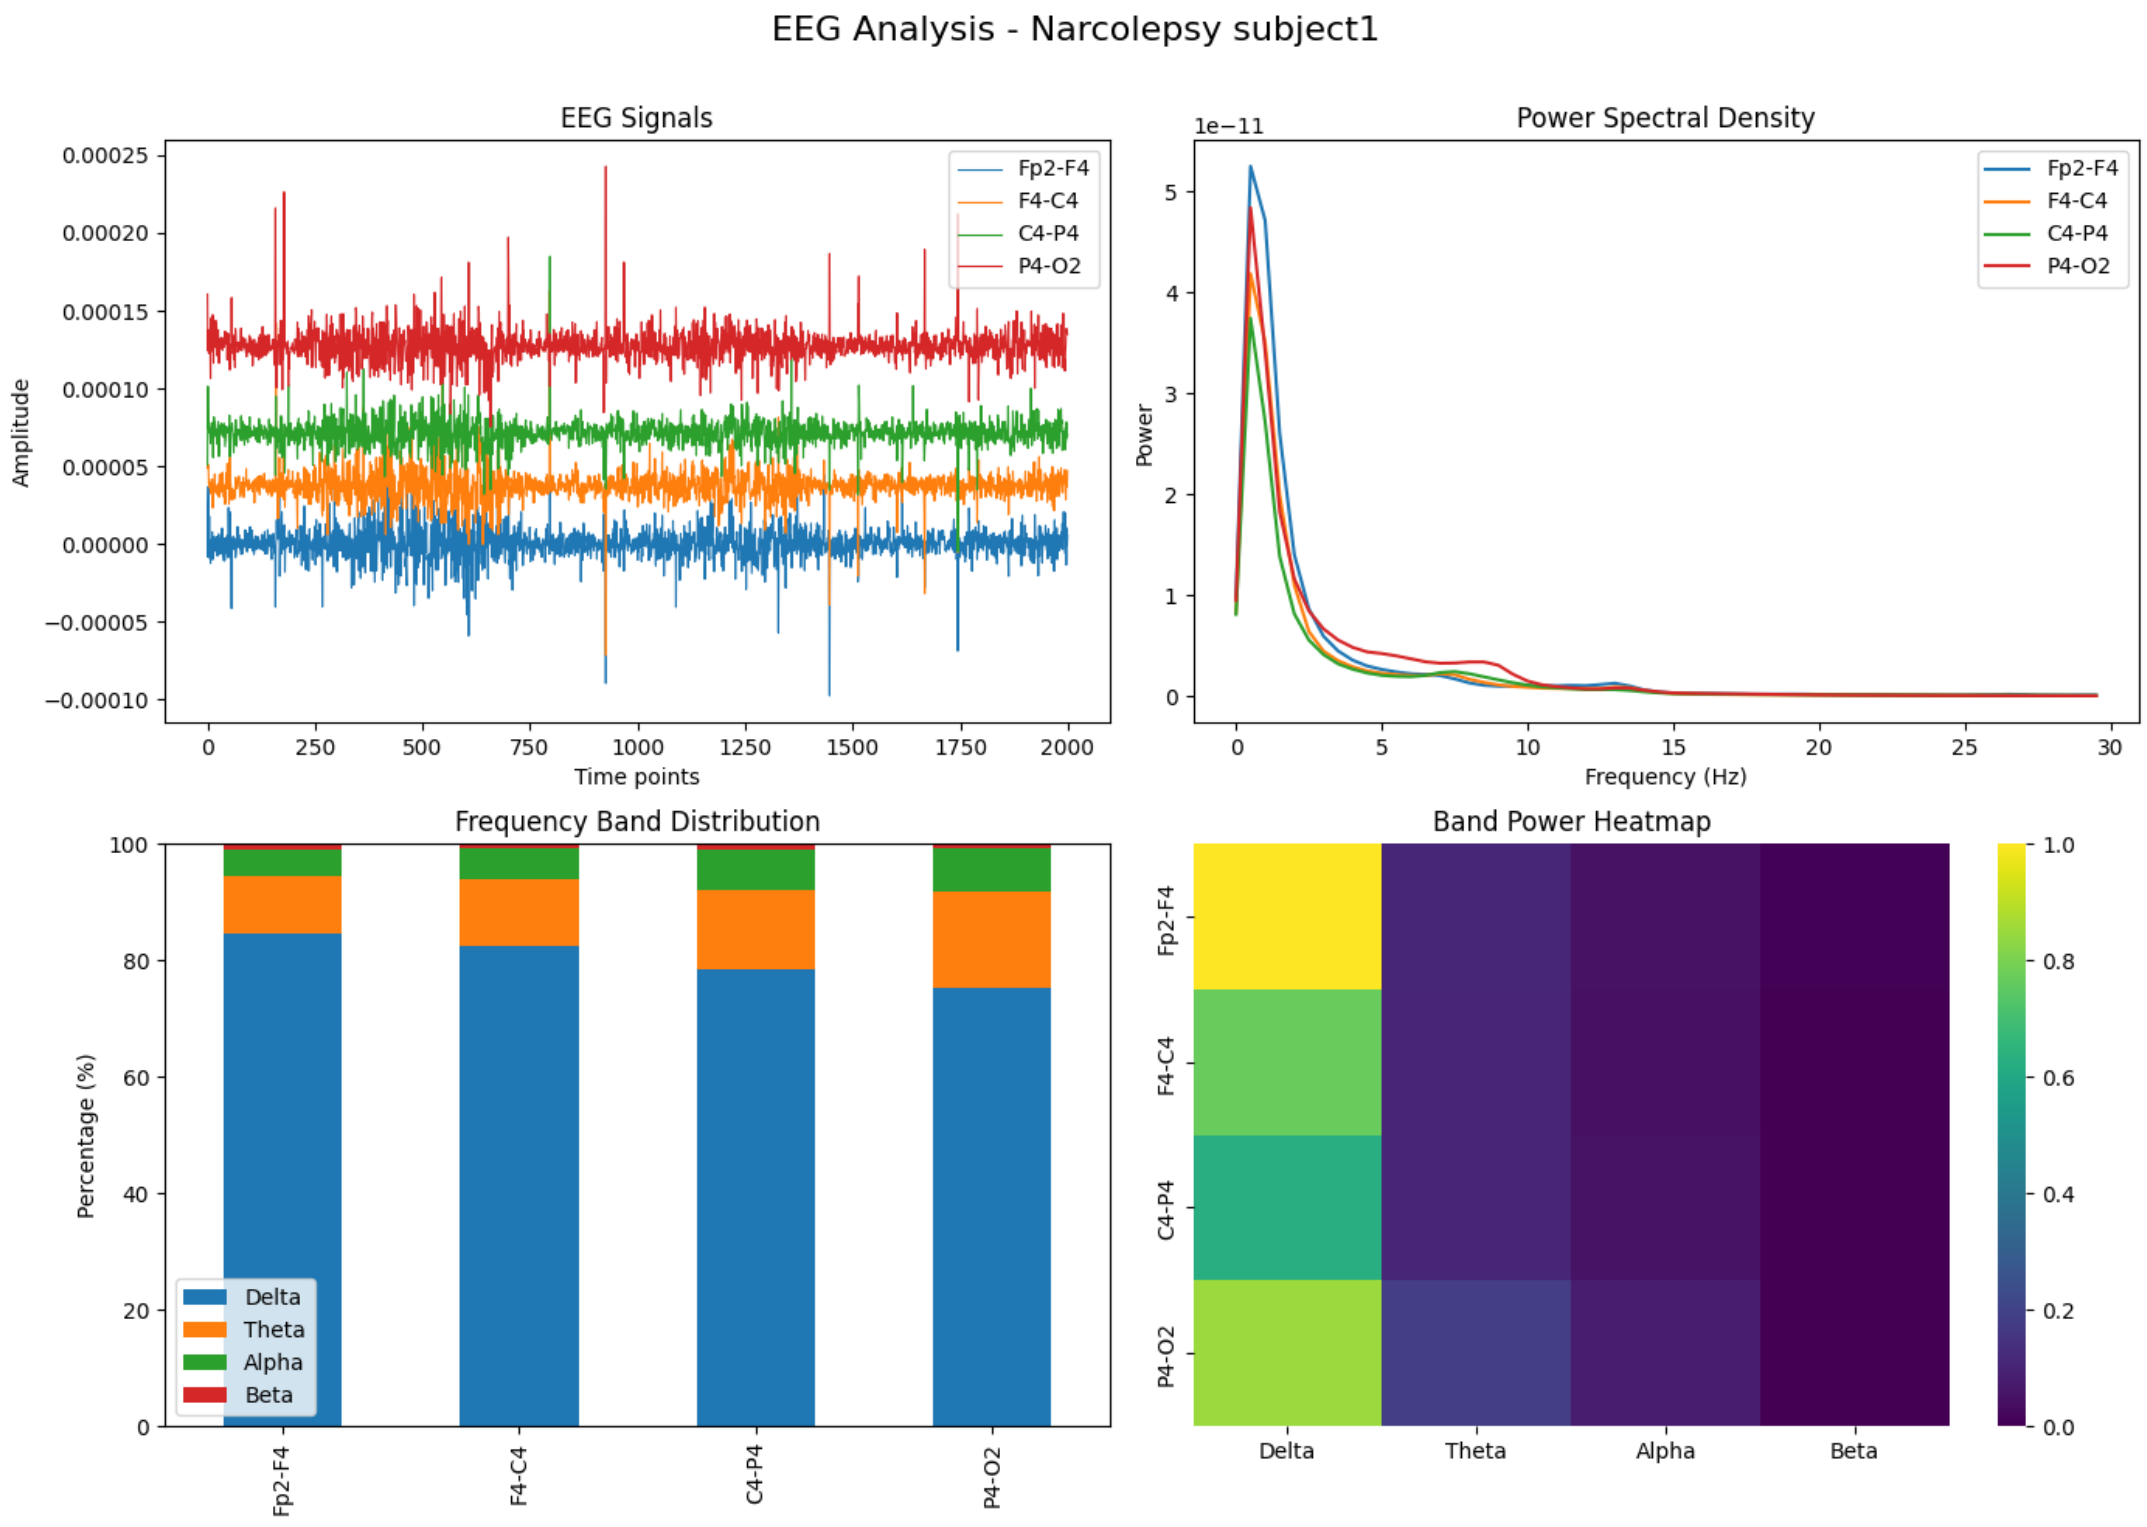
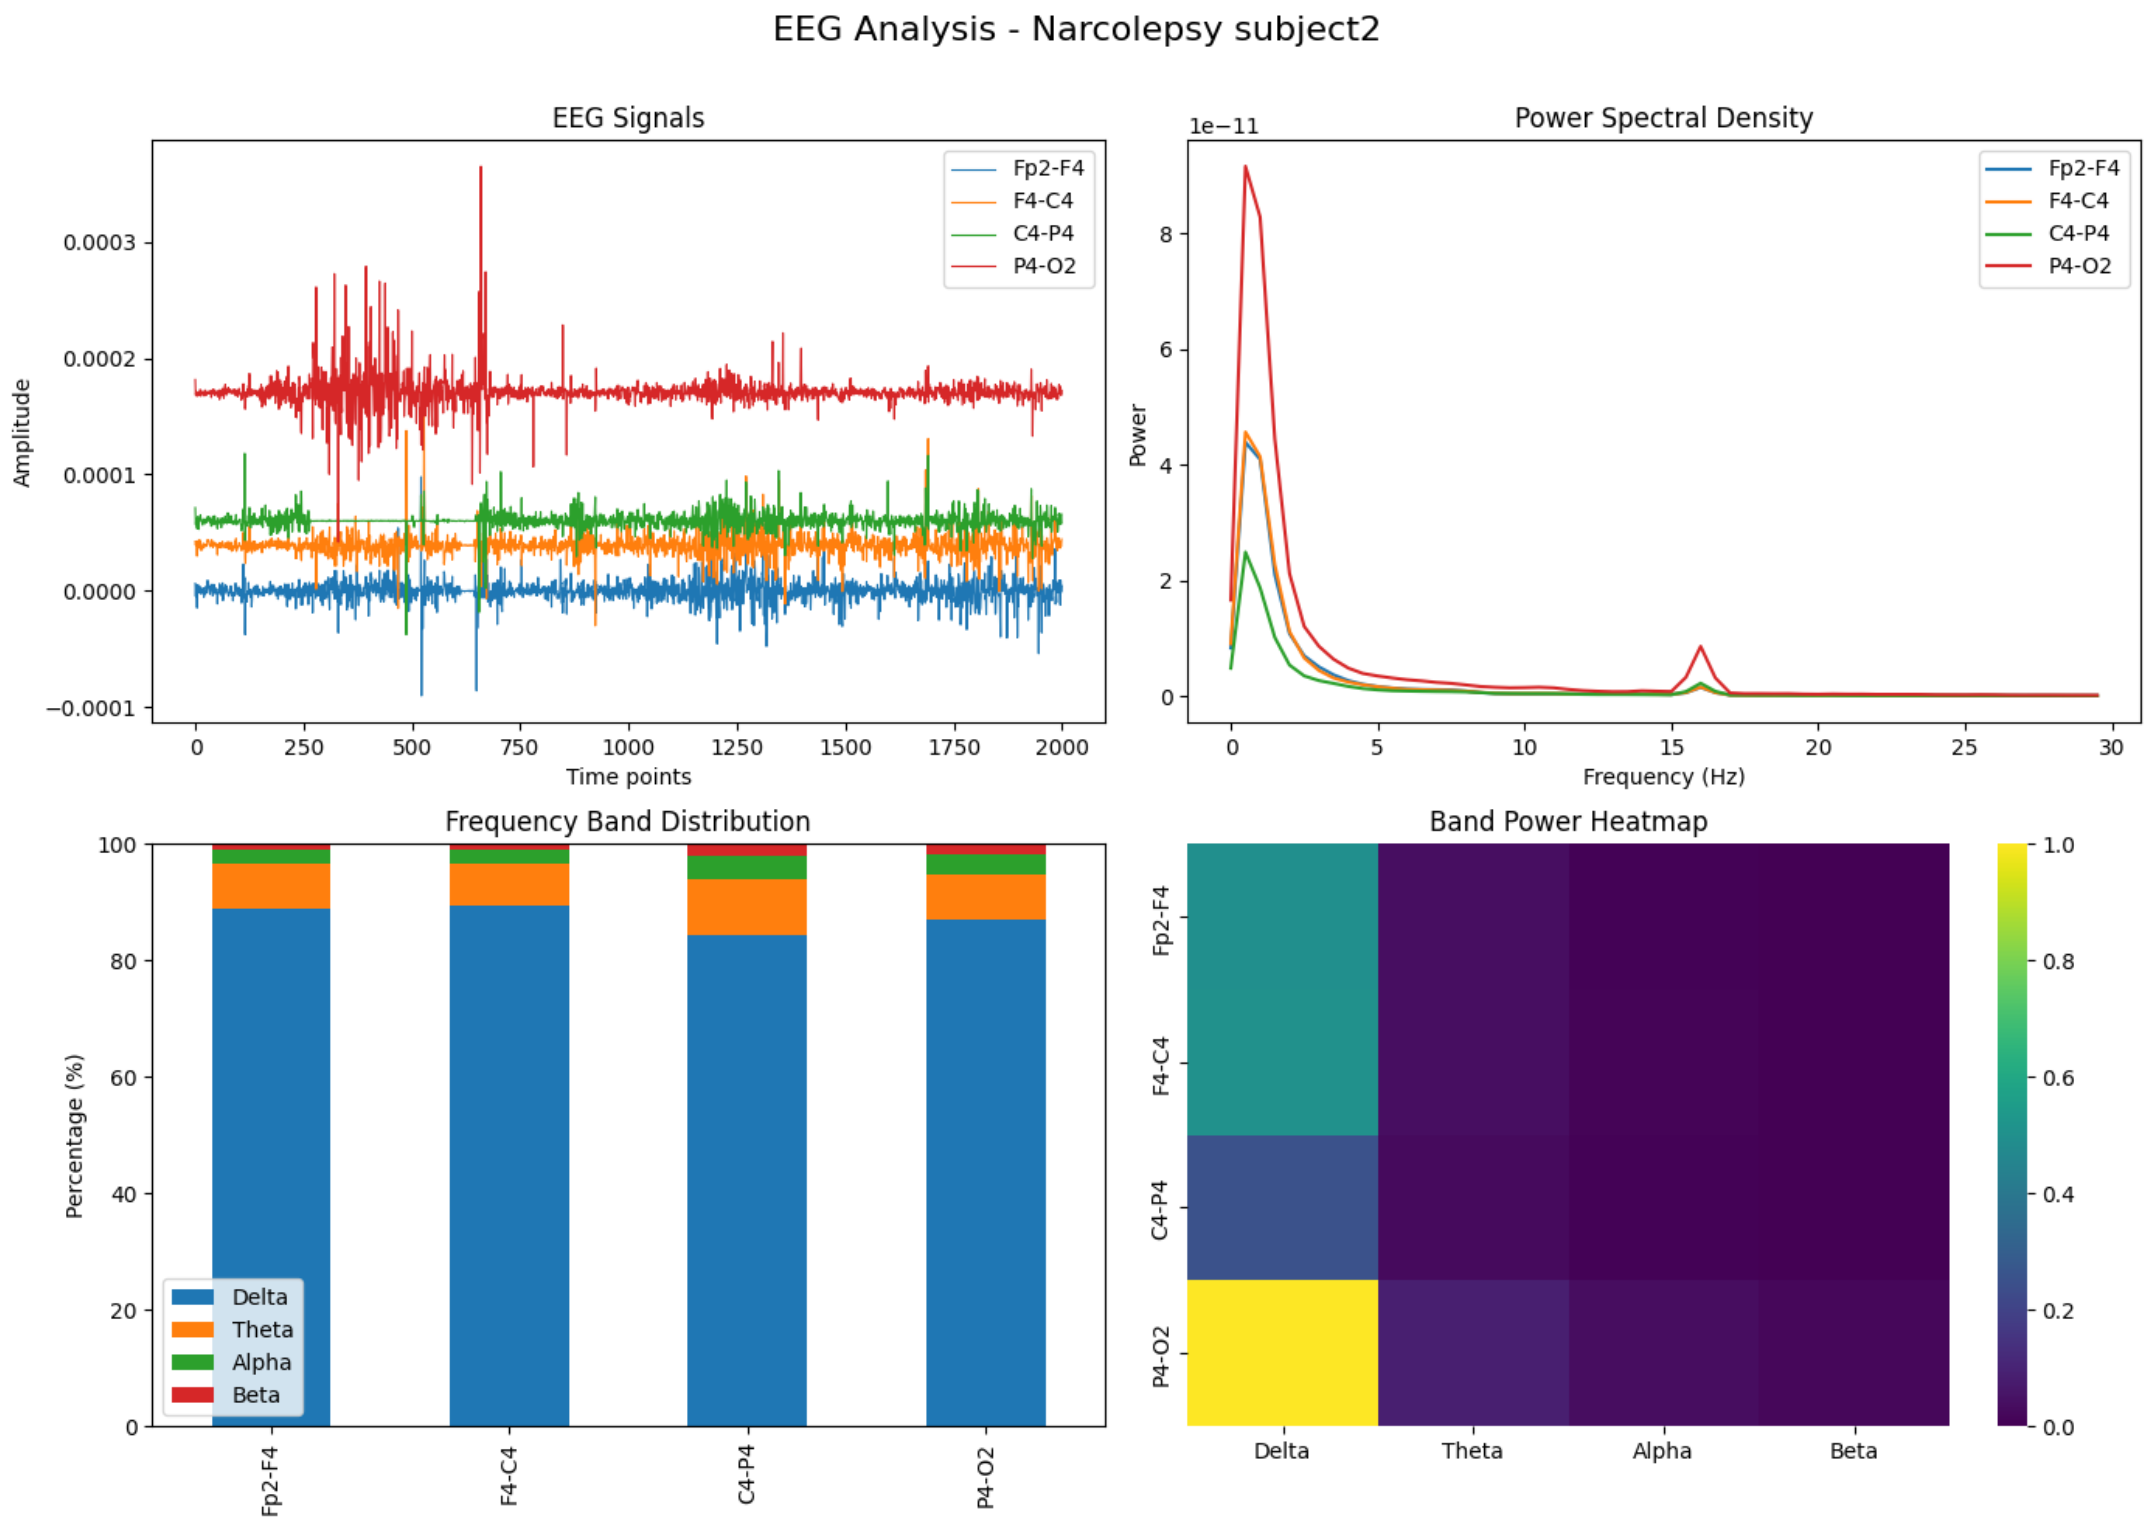
EEG analysis of Narcolepsy subject1 and subject2 shows disrupted sleep activity across all brain areas. Delta waves dominate across all channels — from front (Fp2-F4) to back (P4-O2) — suggesting deep sleep signals are appearing where and when they shouldn't.
Higher-frequency signals (Theta, Alpha, Beta) are weak across the board, indicating poor sleep stage transitions and low brain engagement.
P4-O2, linked to the back of the brain, shows unusually high power, pointing to irregular REM-related activity.
Power Spectral Density plots and heatmaps confirm narrow frequency focus and uneven Delta power, especially in parietal-occipital regions, supporting signs of abnormal sleep regulation typical in narcolepsy.
Overall, the EEG patterns suggest a lack of normal sleep depth and stability, with Delta waves appearing inappropriately during wakefulness or light sleep, characteristic of narcolepsy.
TDA & Channel Activity Heatmaps
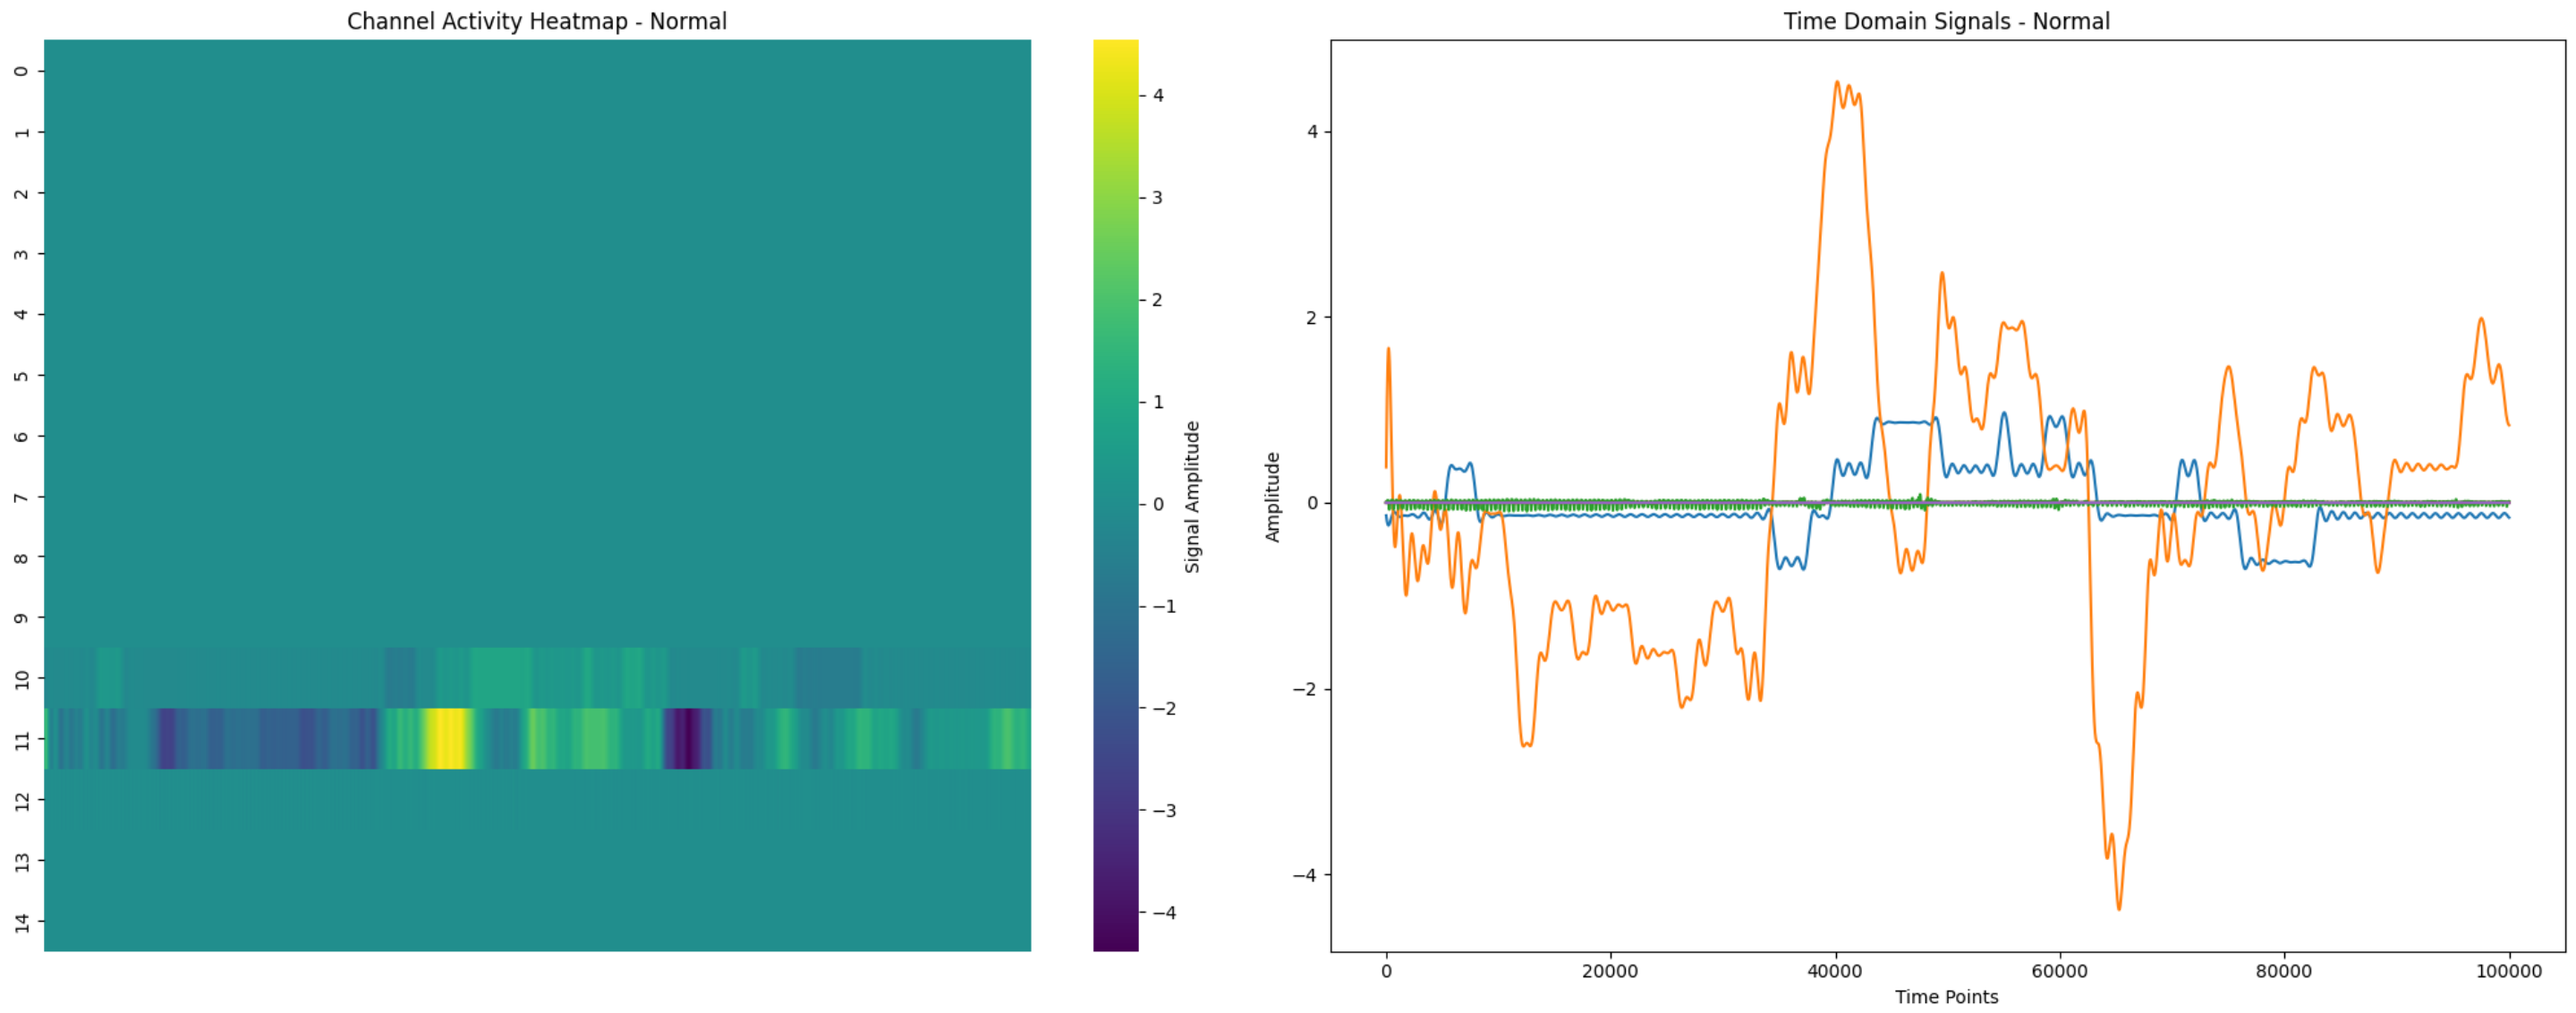

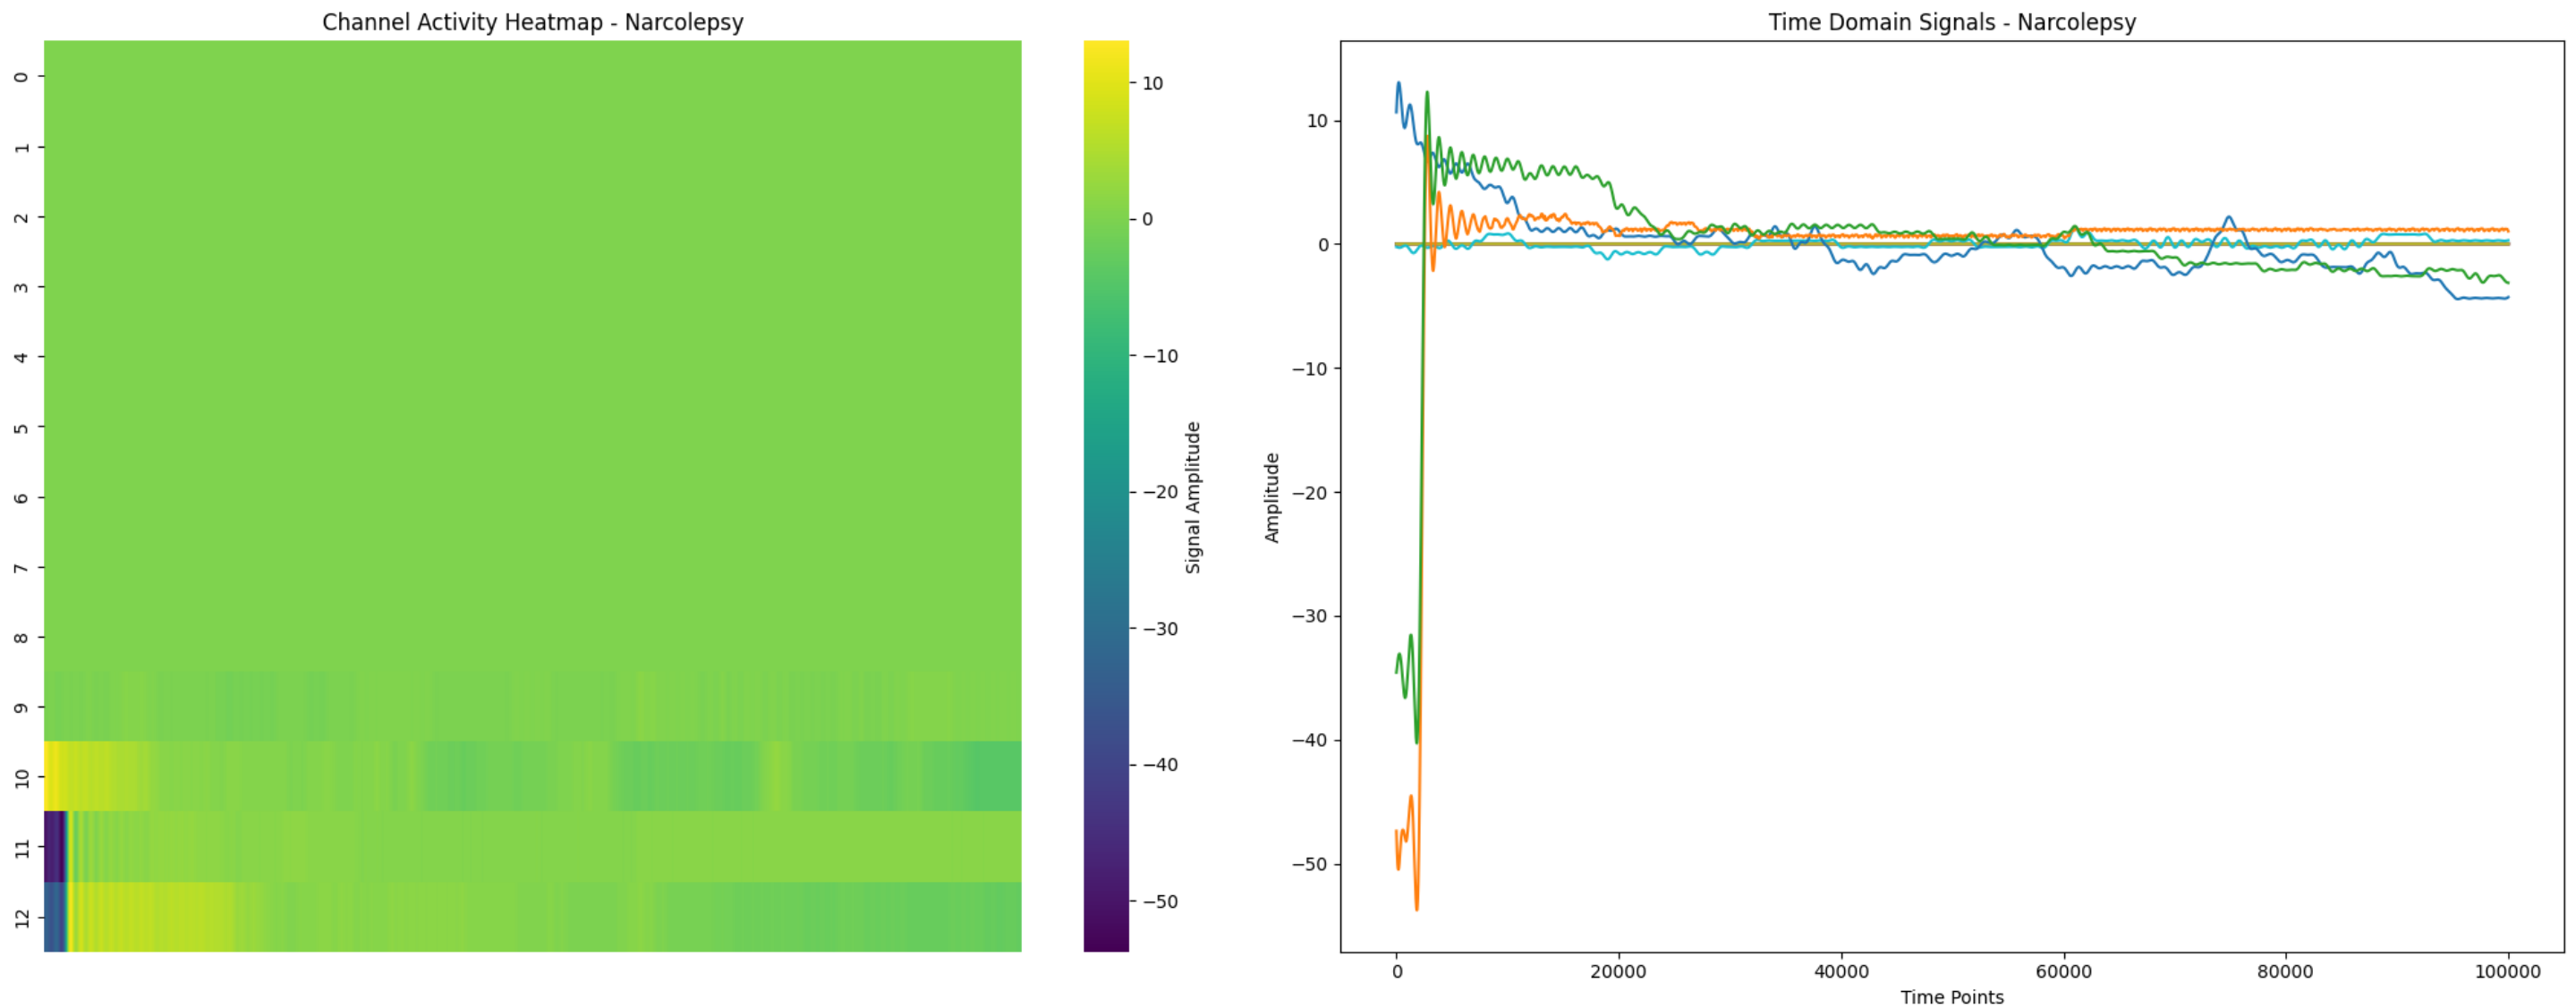
The Time Domain Analysis (TDA) and Channel Activity Heatmaps provide a detailed visualization of EEG activity across different brain regions and time intervals for each subject type:
- Normal Subject: The heatmap shows balanced and consistent activity across all channels, with dominant Delta waves during deep sleep stages. This reflects stable and restorative sleep patterns typical of healthy individuals.
- Insomniac Subject: The heatmap reveals fragmented and uneven activity, with reduced Delta power and increased Alpha or Beta activity in certain regions. This indicates disrupted sleep architecture and difficulty maintaining deep sleep.
- Narcoleptic Subject: The heatmap highlights irregular activity, with Delta waves appearing inappropriately during wakefulness or light sleep. This pattern is characteristic of narcolepsy, where sleep-wake transitions are abnormal and unstable.
These visualizations help identify key differences in sleep patterns and brain activity across normal, insomniac, and narcoleptic subjects, providing insights into their unique sleep characteristics.
Conclusion
This project provides a comprehensive analysis of sleep patterns using EEG data from normal, insomniac, and narcoleptic subjects. By leveraging techniques such as hypnograms, band power analysis, power spectral density plots, and heatmaps, we identified distinct sleep characteristics for each subject type. Normal subjects exhibit stable and restorative sleep, insomniacs show fragmented and shallow sleep, and narcoleptics display irregular sleep-wake transitions with abnormal REM activity. These insights highlight the potential of EEG-based analysis in understanding and diagnosing sleep disorders.